The Problem with a Free Lamborghini… It Works!
Why lowering your CAC is killing your business.
By Joseph Brady · October 27, 2026
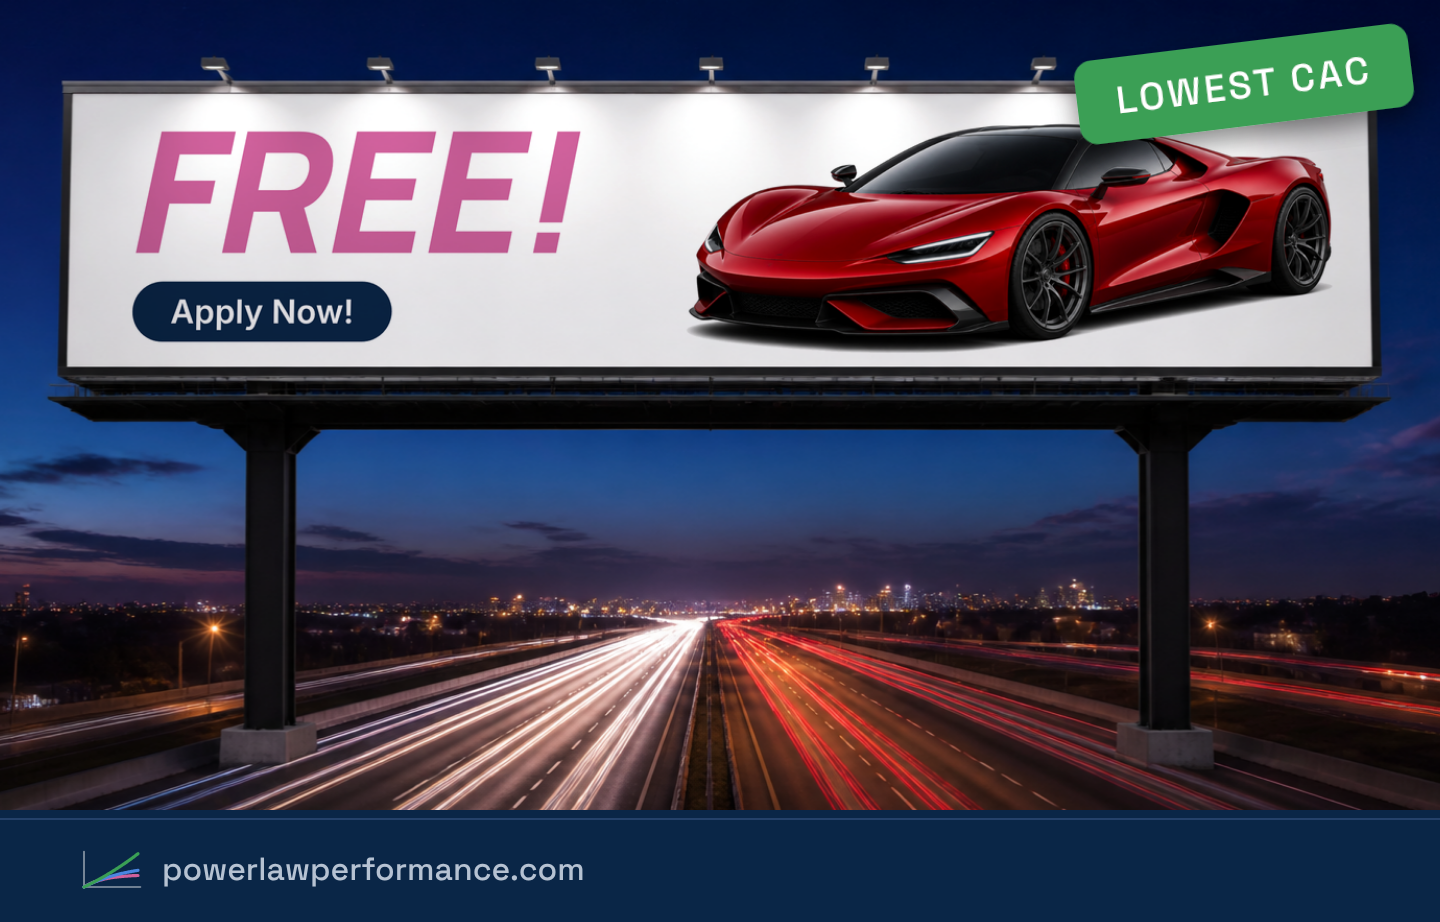
When every sale counts the same, the ad that sells the most cars is the one quietly putting the dealership out of business.
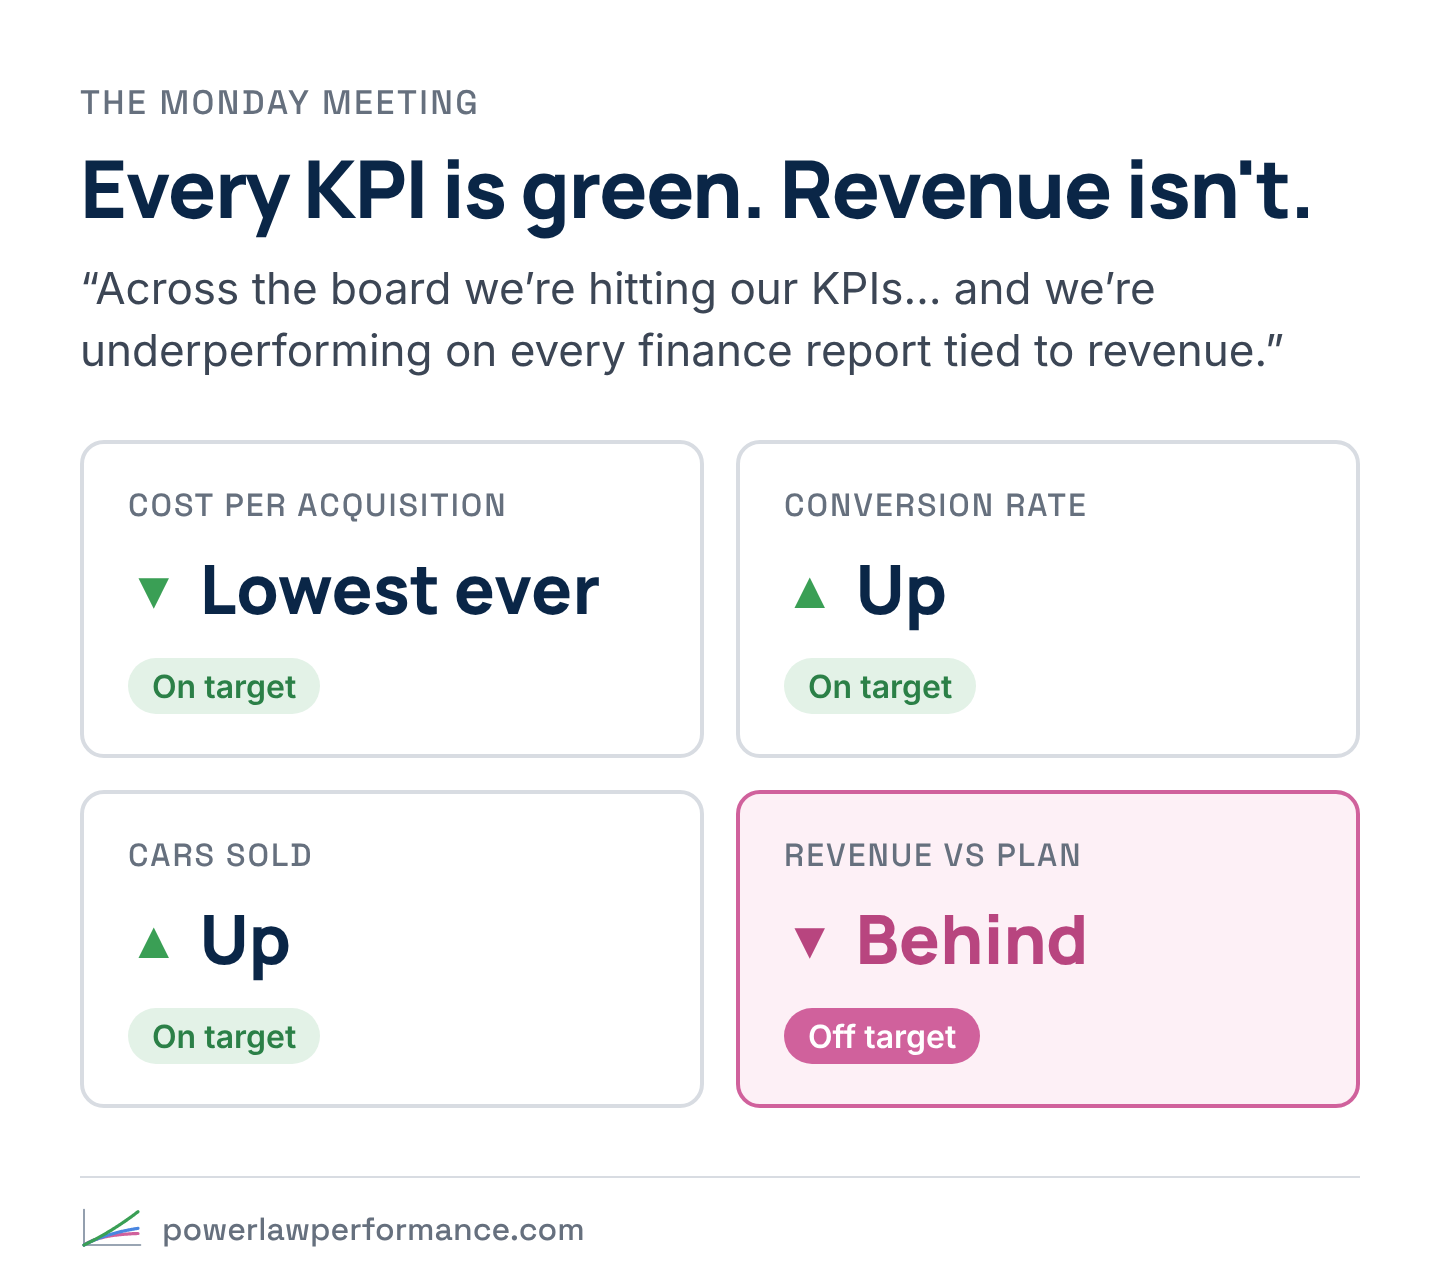
Have you ever been in a room where the CEO looks at the dashboard and says some version of this: “I don’t get it. Across the board we’re hitting our KPIs, cost per acquisition has never been better, conversion rates are up across the board, but we seem to be underperforming on every finance report tied to revenue?”
Nobody in that room did anything wrong. In fact, everyone has been doing everything right. That’s what makes the question so hard to answer. Here’s how a team gets there, one good decision at a time.
Sell more cars
It’s your first week running advertising for a dealership. The brief fits on a sticky note: sell more cars.
You do what any good marketer would do, and you do it well. You put up several billboards, give each one its own offer, and run holdout tests against a control, so you know what each billboard adds beyond the traffic you’d have gotten anyway.
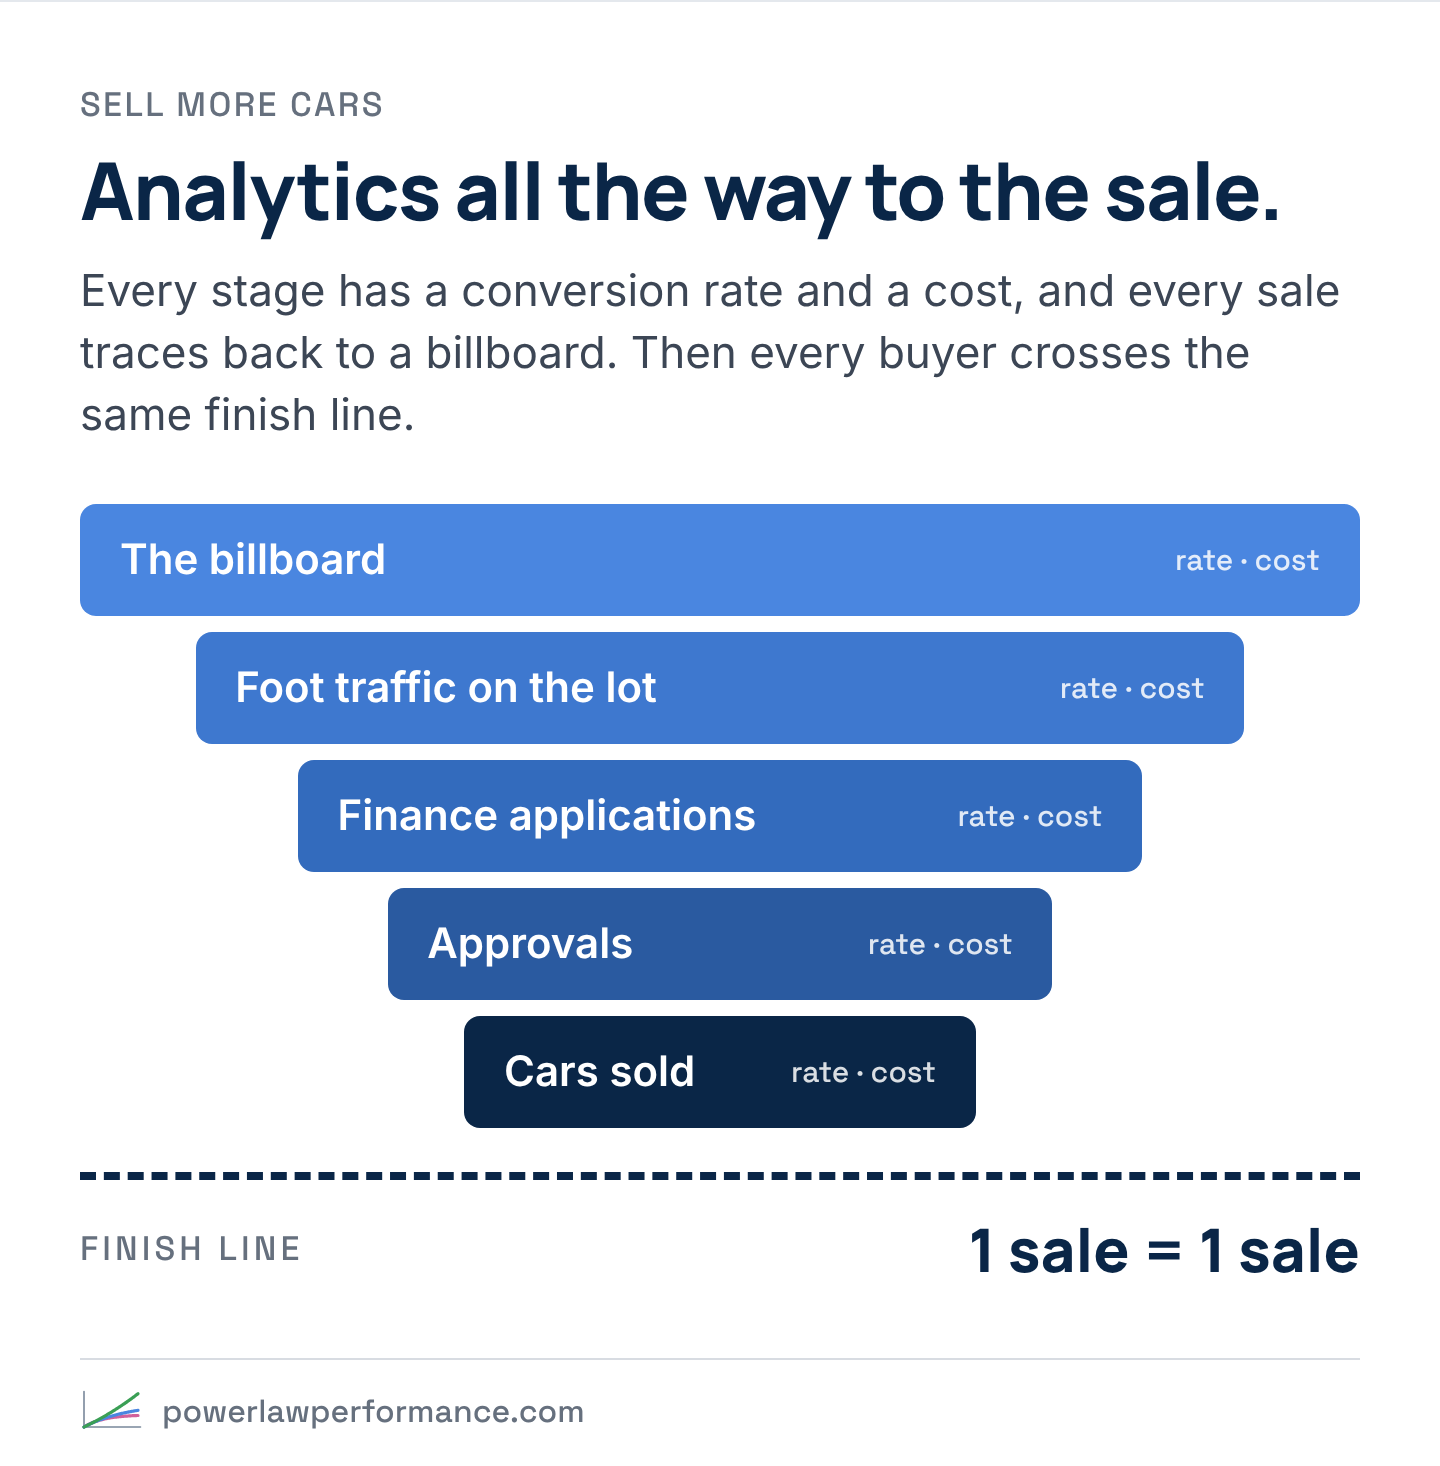
Then you measure every step that follows. You know which billboard drives foot traffic onto the lot. You know how much of that foot traffic turns into finance applications, which applications make it through underwriting, and which approvals turn into signed paperwork and a car driving off the lot. Every stage has a conversion rate and a cost, and every sale traces back to the billboard that brought the buyer in.
That’s more than plenty of marketing teams ever get. Many stop measuring at the lead or the store visit. You have analytics all the way through the sale.
Each month you move budget toward the billboard credited with the most cars sold at the lowest cost, and away from the ones that sell the fewest. The report is simple, and the whole team can rally behind it: foot traffic, applications, approvals, cars sold, and what each one cost you.
In that report, every sale is the same event. A sale is a sale. And that’s where full-funnel analytics stops protecting you. You can measure every step perfectly and still steer toward the wrong customer, because the finish line counts every buyer the same.
The billboards keep getting better
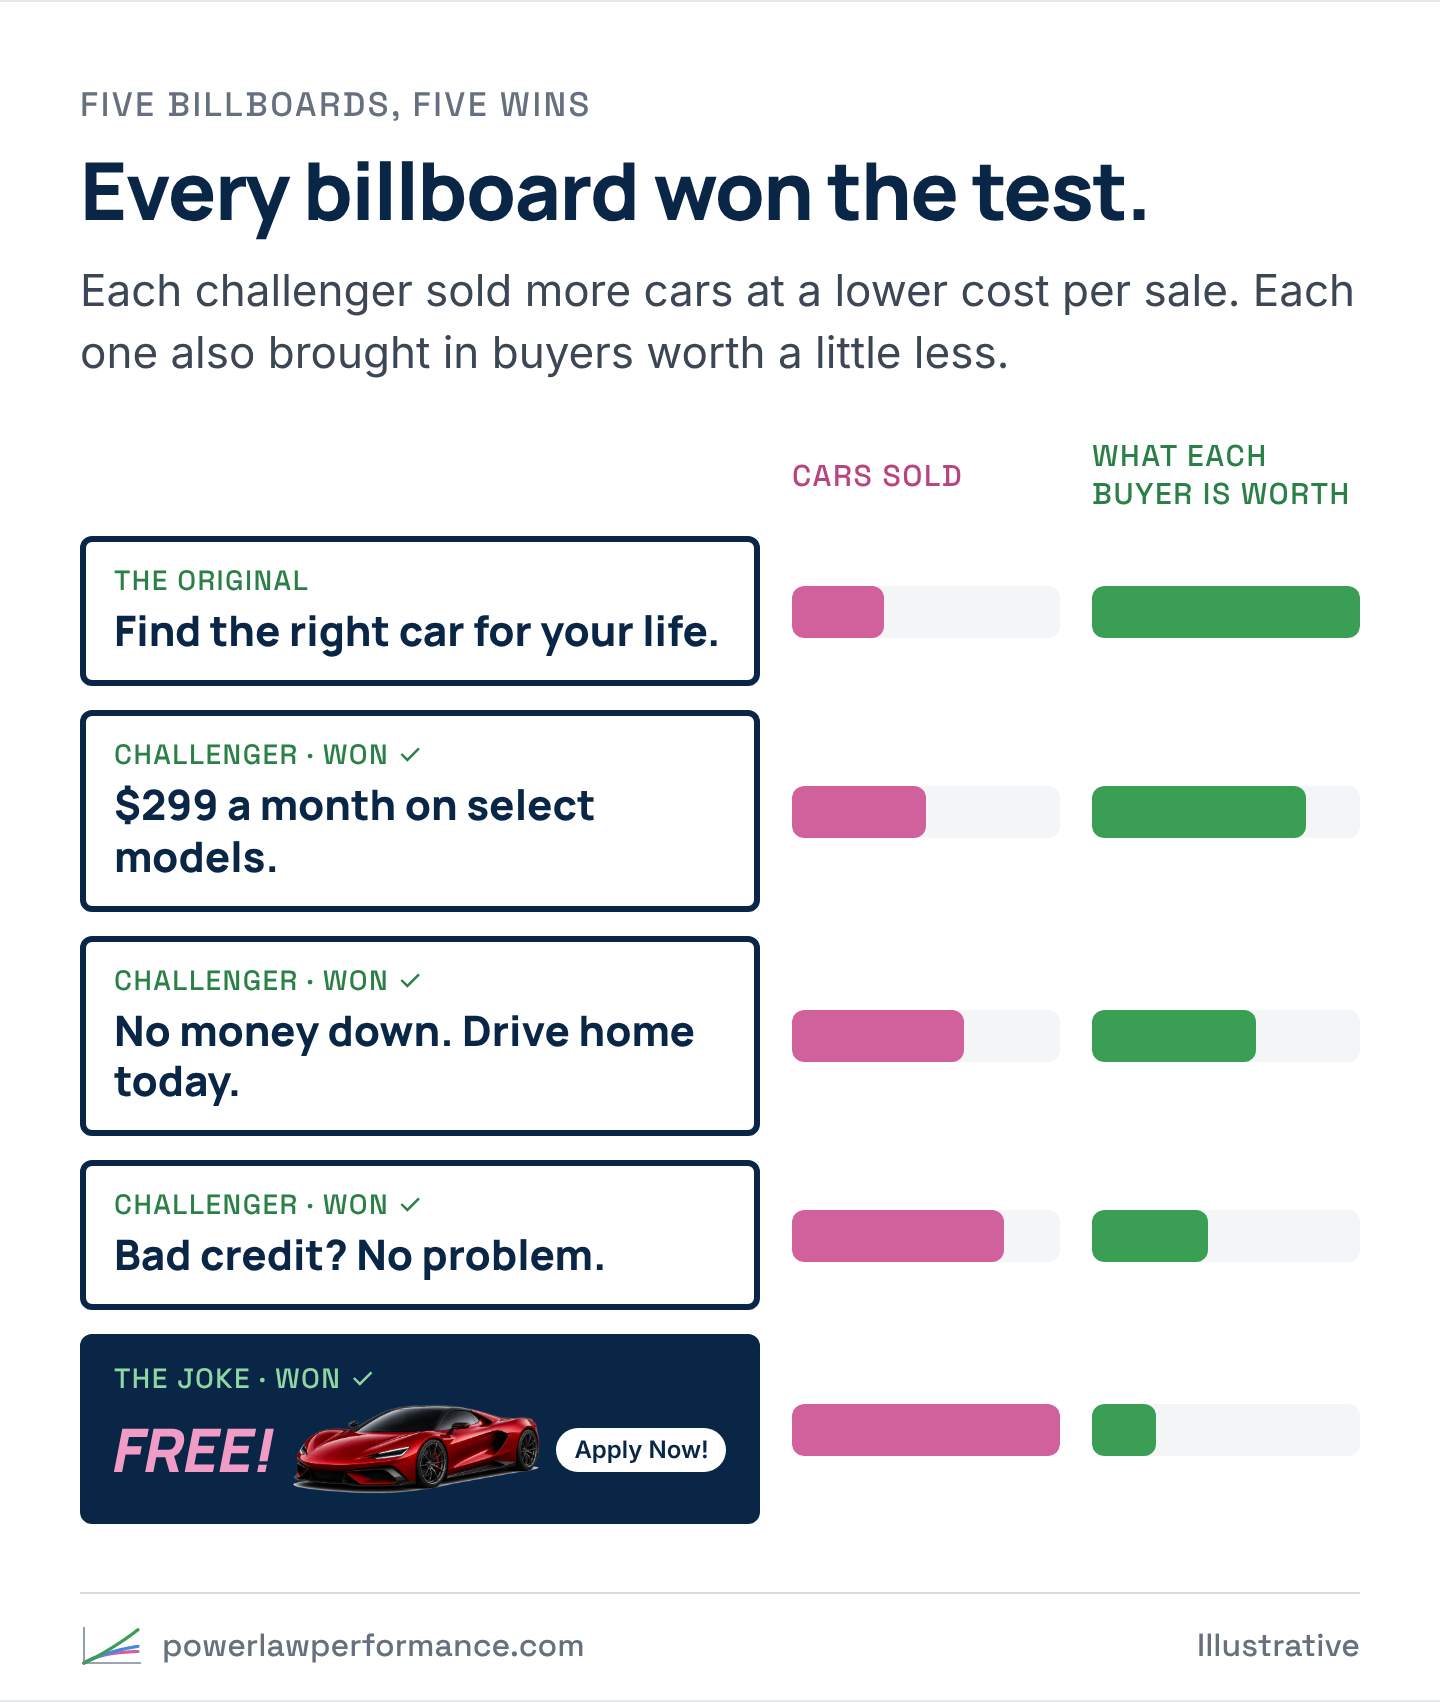
The first billboard is the one the dealership has always run: “Find the right car for your life.” It sells cars at a steady pace.
You test a challenger: “$299 a month on select models.” It wins. More buyers, lower cost per sale, so the budget moves.
Next round, “No money down. Drive home today.” It wins again. Then “Bad credit? No problem.” Another win. Each new billboard beats the last one on exactly the measure you’re judged on, and each decision is easy to defend in the Monday meeting.
Eventually someone pitches the limit case, half as a joke: a picture of the most expensive car you’ve ever seen, “FREE!” in giant letters over it, and a button that says “Apply Now!”
And it works. Nobody drives home in a Lamborghini, but plenty of people drive home in something. The lot has never been busier. The finance office stays open late to keep up. Cost per car sold, the dealership’s CAC, is the lowest it has ever recorded. Every report says the marketing is working, because by every measure on the report, it is.
That’s the problem with a free Lamborghini. It works.
A sale was never just a sale
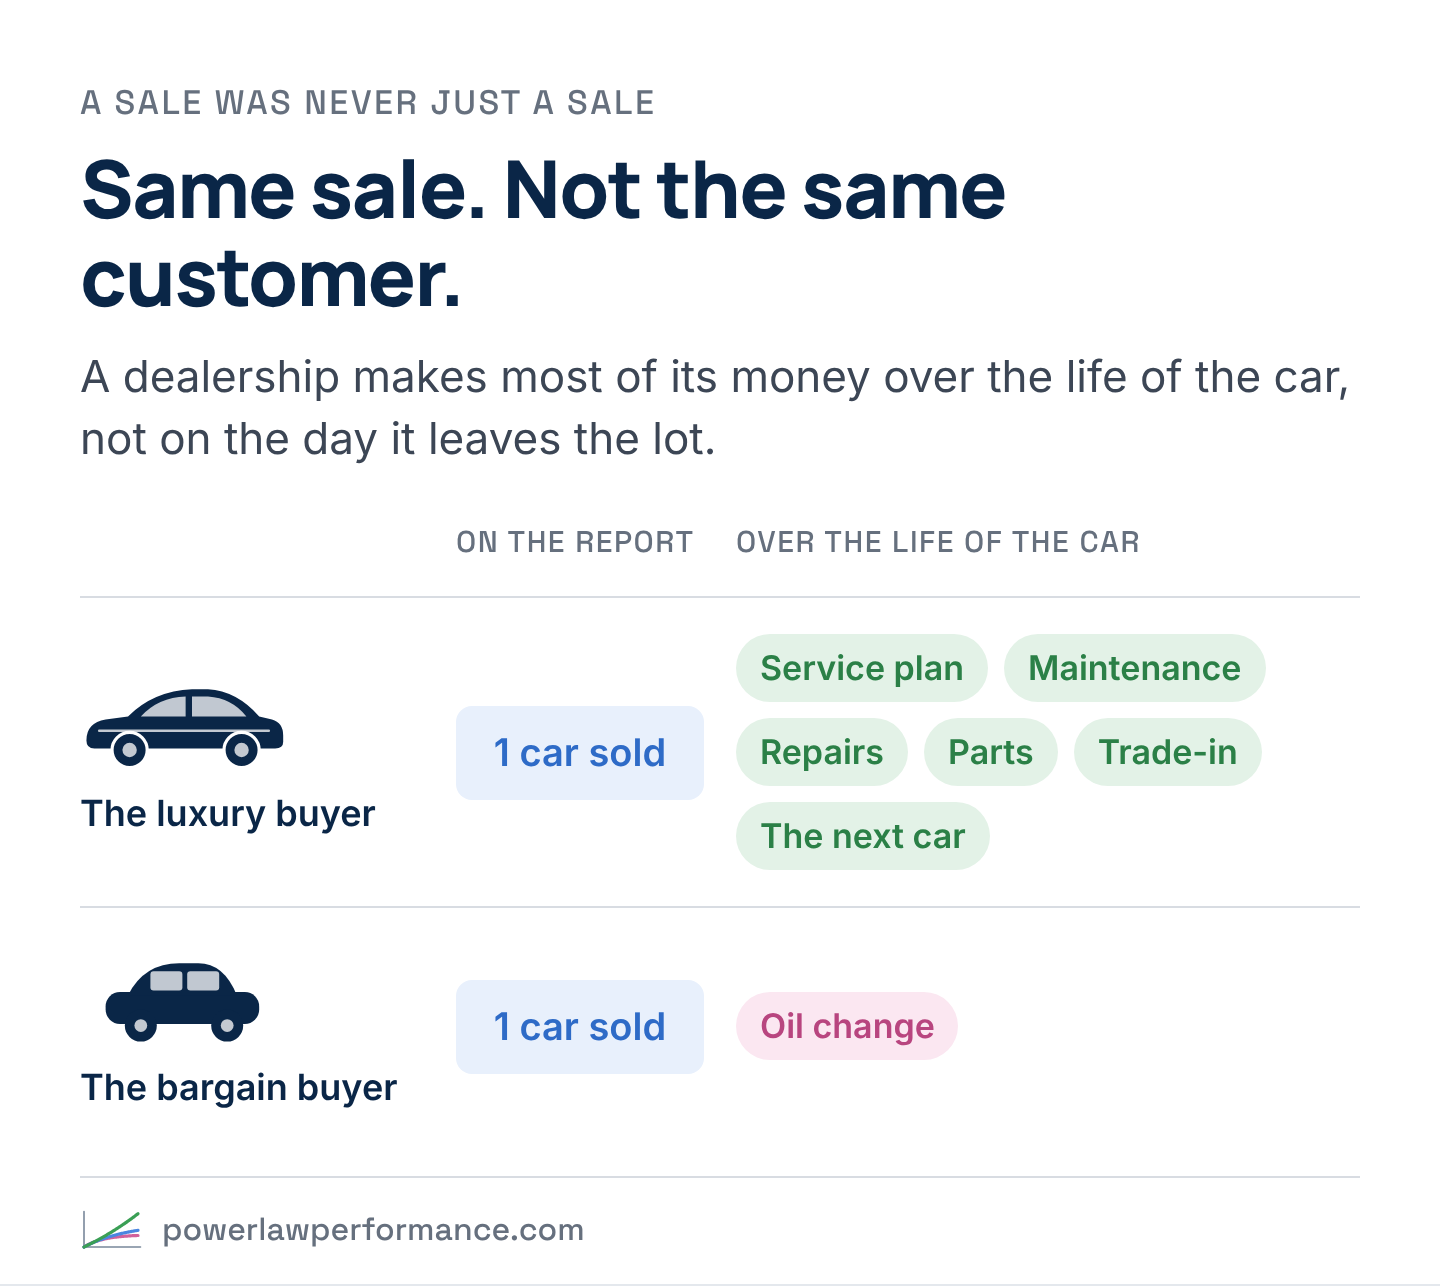
Here’s what the report can’t see. A dealership doesn’t make most of its money on the day a car leaves the lot. It makes it over the life of the car: the service plan, the scheduled maintenance, the repairs, the parts, and the trade-in that brings the customer back for the next one.
That lifetime value isn’t spread evenly. A luxury car comes back to the service bay for years, and every visit is a bigger ticket. A bargain commuter car barely covers its oil changes. Two sales can look identical on the billboard report and be worth wildly different amounts to the business over the years that follow.
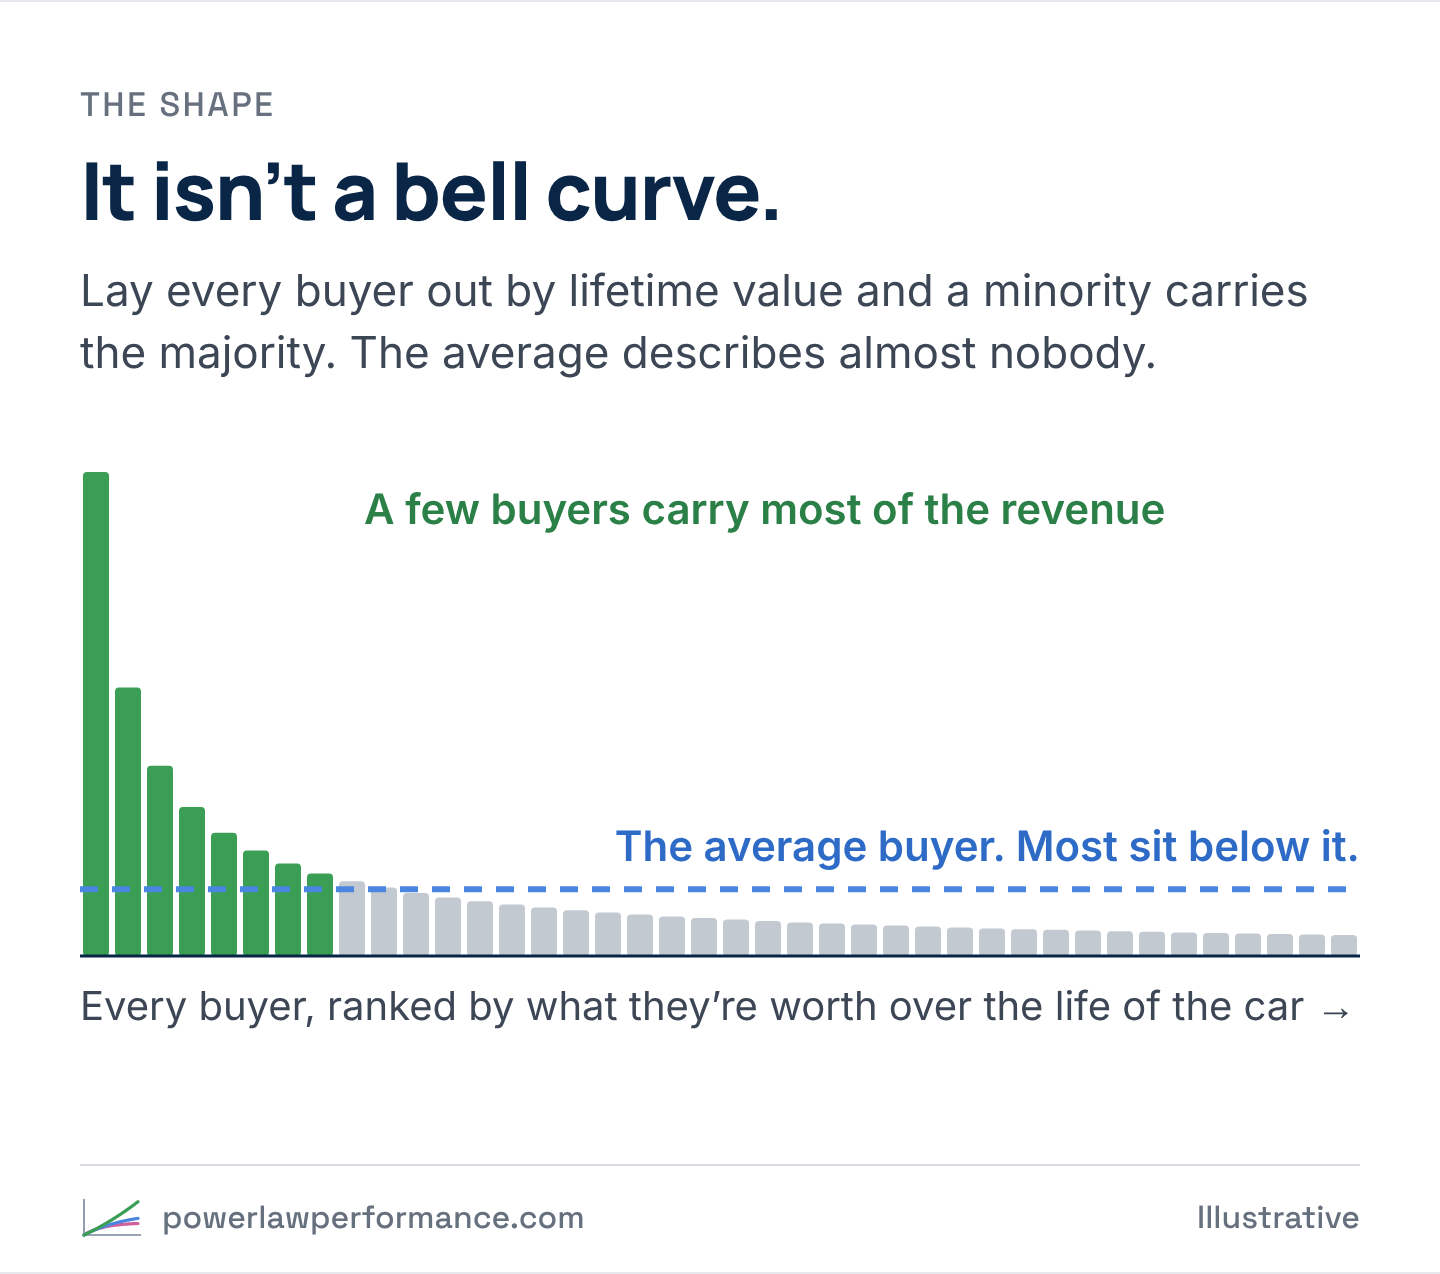
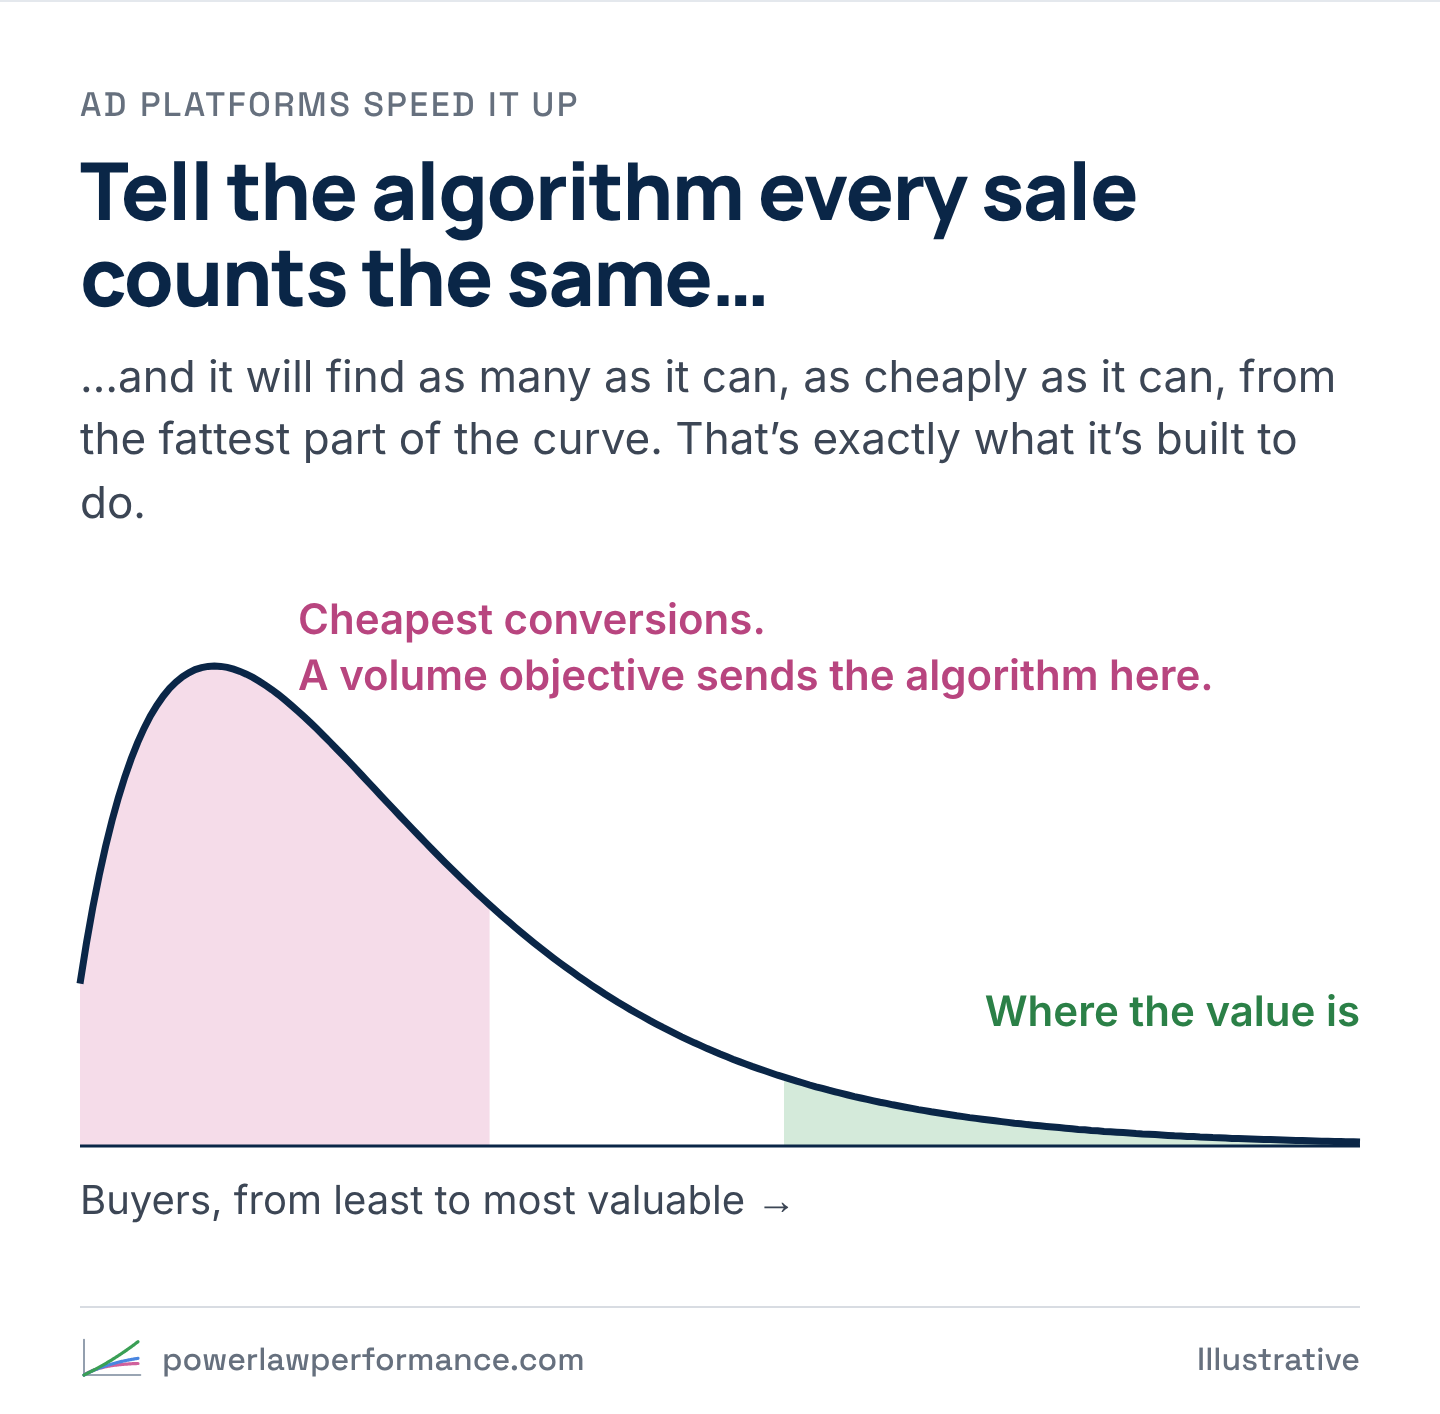
Lay every buyer out by what they’re worth over the life of the car and the shape isn’t a bell curve. A minority of buyers carries the majority of the dealership’s long-term revenue. That shape is a power law, and it changes what “best billboard” means.
What the billboards actually optimized
Go back through those tests with that in mind.
“Find the right car for your life” spoke to buyers who walked in knowing what they wanted, including the ones shopping for luxury models. Every challenger that beat it won by widening the door: lower payments, less money down, looser credit, and finally something for nothing. Each one brought in more buyers. Each one also brought in a slightly different buyer: more price-driven, more stretched, more likely to drive off in the cheapest car on the lot and less likely to come back for service.
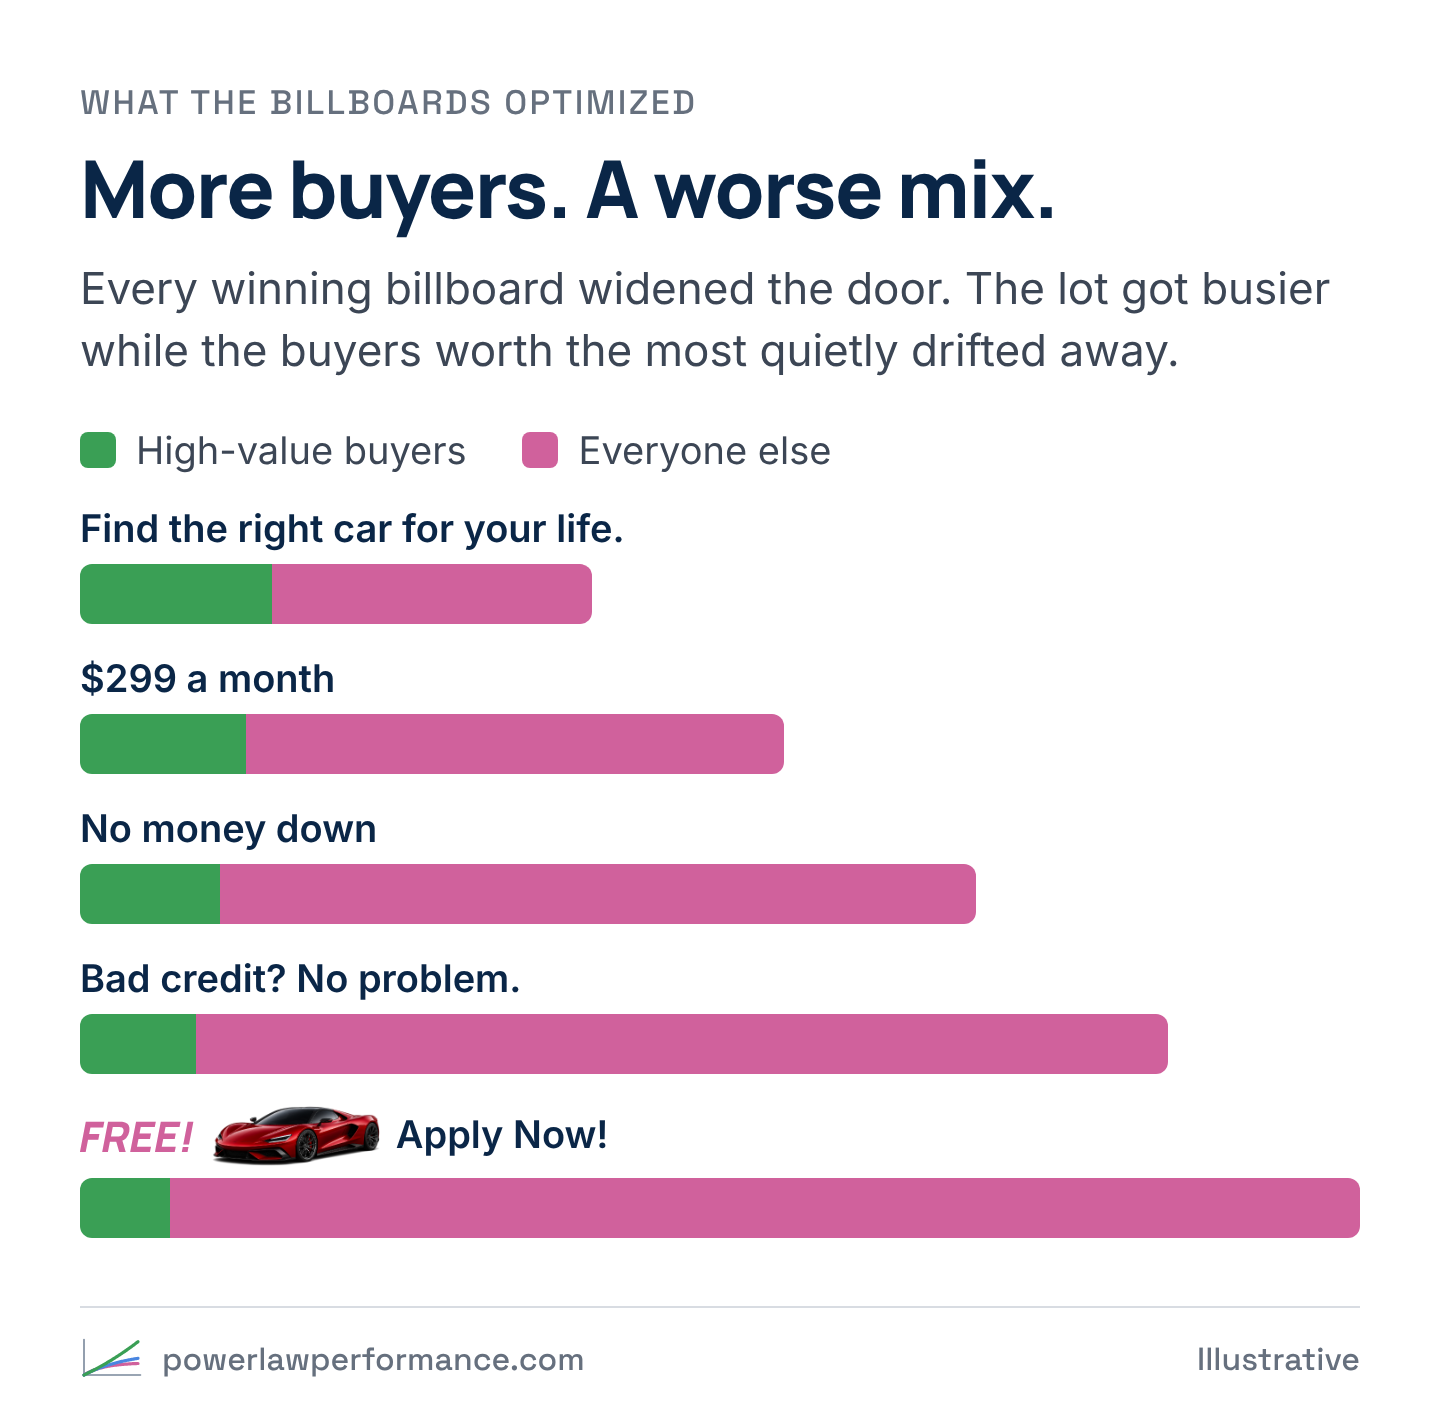
The tests didn’t fail. They answered the question they were asked: which billboard sells the most cars? Nobody asked which billboard brings in the buyers worth the most.
The damage compounds in three ways:
- The lot is finite. Salespeople, finance-desk hours and service bays get used up closing and servicing low-value deals. Capacity that used to go to high-value buyers now goes to volume.
- The high-value buyers drift away. The buyer shopping for a luxury car drives past a billboard promising a free Lamborghini and reads it for what it is. The ads stopped speaking to them, and the dealership now stands for something they don’t want. They take their business, and years of service visits, down the road.
- The average falls out from under the plan. The cost-per-sale target was set on the dealership’s average sale, and that average was always carried by the minority of high-value buyers. Every month the mix shifts toward the cheap end, the real average drops further below the one the plan assumed.
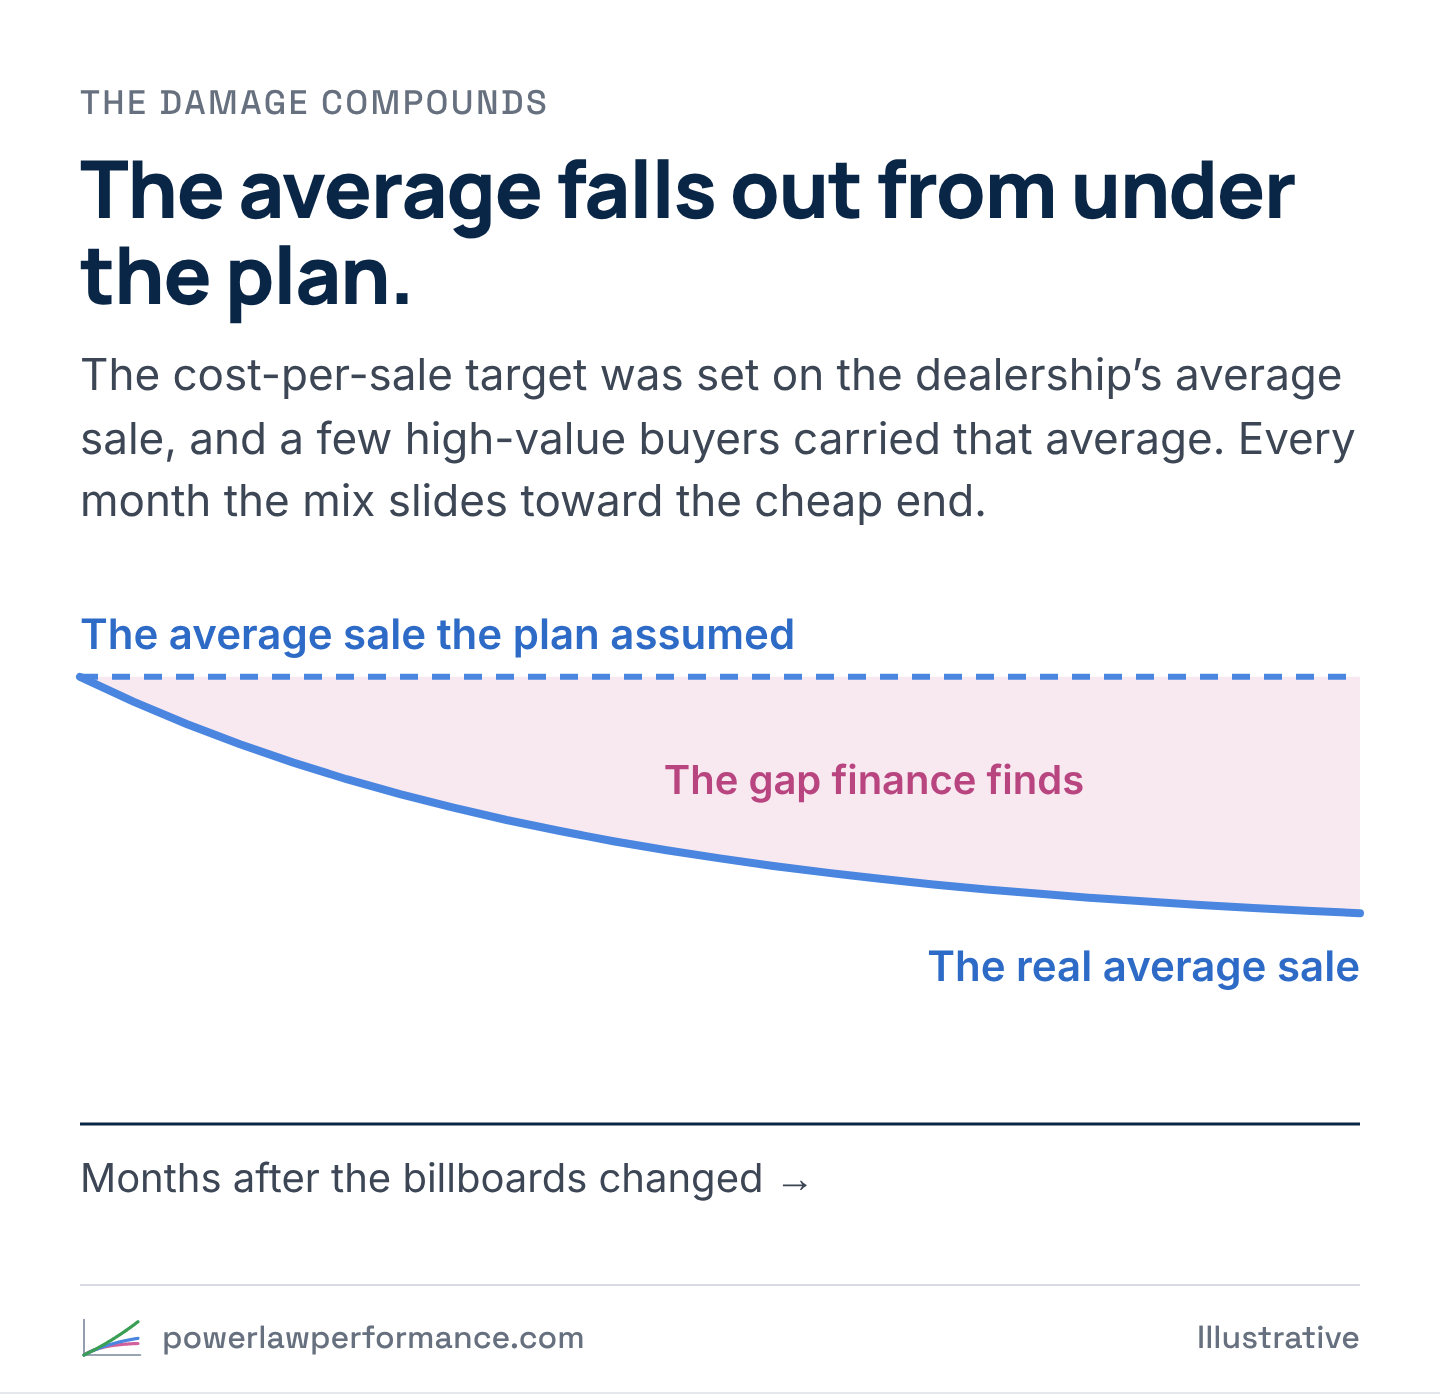
Volume goes up and value goes down. Everyone hit their numbers, and the numbers were pointed at the wrong customer.
None of this shows up right away. The first year’s sales look great. It shows up later, when the service revenue that should have followed those sales never arrives and the year’s new customers return less than the plan predicted. It might not kill the dealership fast, but it will kill it.
This has a name: adverse selection
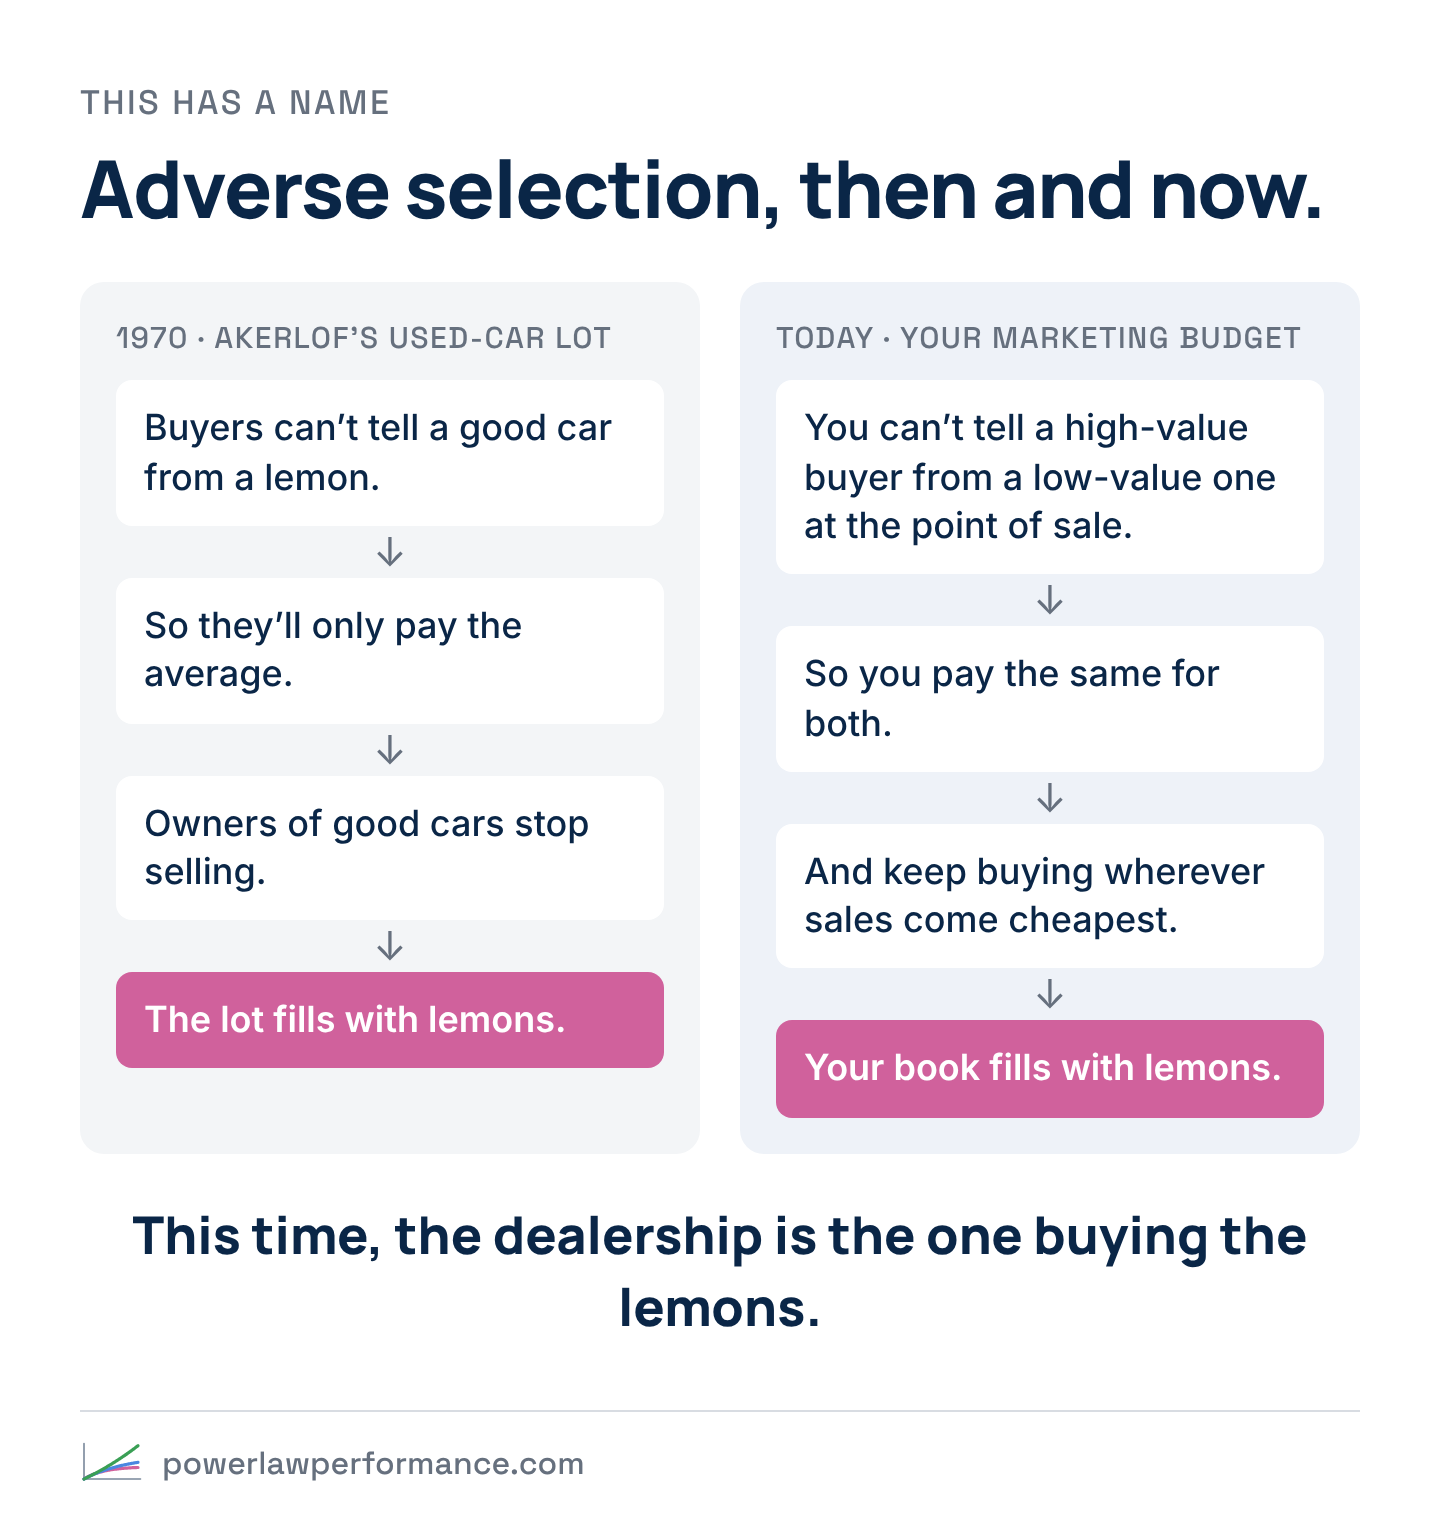
In 1970 the economist George Akerlof described this mechanism in “The Market for ‘Lemons.’” His example was a used-car lot. The seller knows which cars are lemons; the buyer can’t tell a good car from a bad one at the point of sale, so the buyer will only pay the average price. That price is too low for the owners of good cars, the peaches, so they stop selling. The cars left on the lot are more and more likely to be lemons. Nobody behaved badly. The market drifted toward lemons because nobody could tell the difference at the moment of the sale.
Now put the dealership back in the story, in the other seat. In Akerlof’s market, the buyer was the one who couldn’t see quality. In ours, the dealership is the buyer. Every billboard dollar buys customers, and the customer knows far more about what kind of buyer they are than the dealership does. At the moment of the sale, a buyer who’ll bring a luxury car back to the service bay for years and a buyer who’ll barely cover an oil change look identical: one car sold. So the dealership pays the same for both, keeps buying wherever sales come cheapest, and slowly fills its book with lemons.
This time it’s the dealership buying the lemons, because it’s the one that can’t tell value from volume at the time of sale. Its optimization values every sale at the average and buys the cheapest sales it can find, and the cheapest sales are usually cheapest for a reason.
Ad platforms speed this up. Tell an algorithm that every sale is a conversion and it will do exactly what you asked: find as many as it can, as cheaply as it can, from the fattest part of the curve. That’s what it’s built to do. It has no way of knowing that the conversions it’s finding are the ones worth the least.
That’s why volume-based optimizations are naturally biased against value. Beat the volume KPI, and you lower the average.
It isn’t about cars
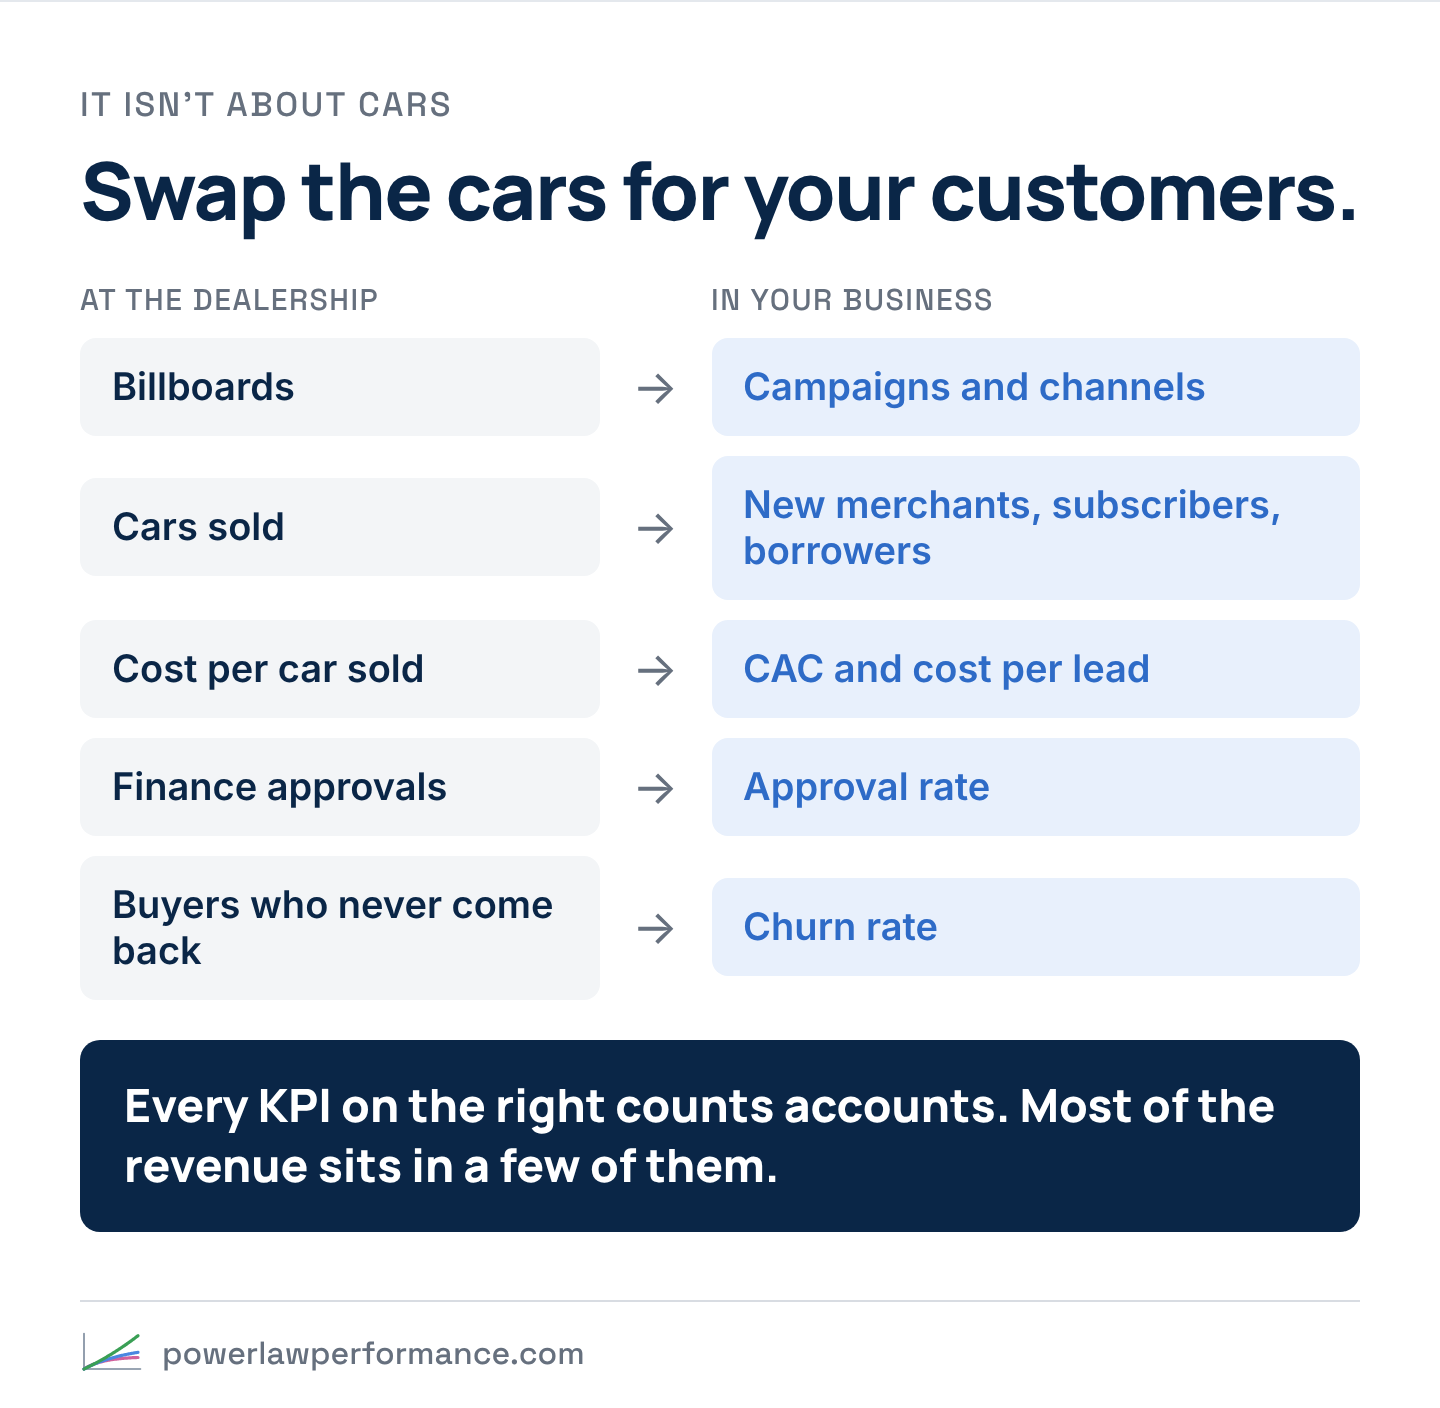
Swap the billboards for campaigns and the cars for merchants, subscribers or borrowers, and this is the story of most recurring-revenue businesses. A minority of accounts carries the majority of revenue, and almost every KPI the team is handed counts accounts: cost per lead, customer acquisition cost (CAC), approval rate, churn rate. Each one quietly points at the accounts worth the least.
I learned this the hard way. Earlier in my career I was hitting every number I’d been given and was still told my accounts were underperforming. A data analyst walked me through why. My deals looked like the company’s average deal, but I never brought in the big ones. Another channel occasionally landed an account several times larger, and those accounts carried the average I was being measured against.
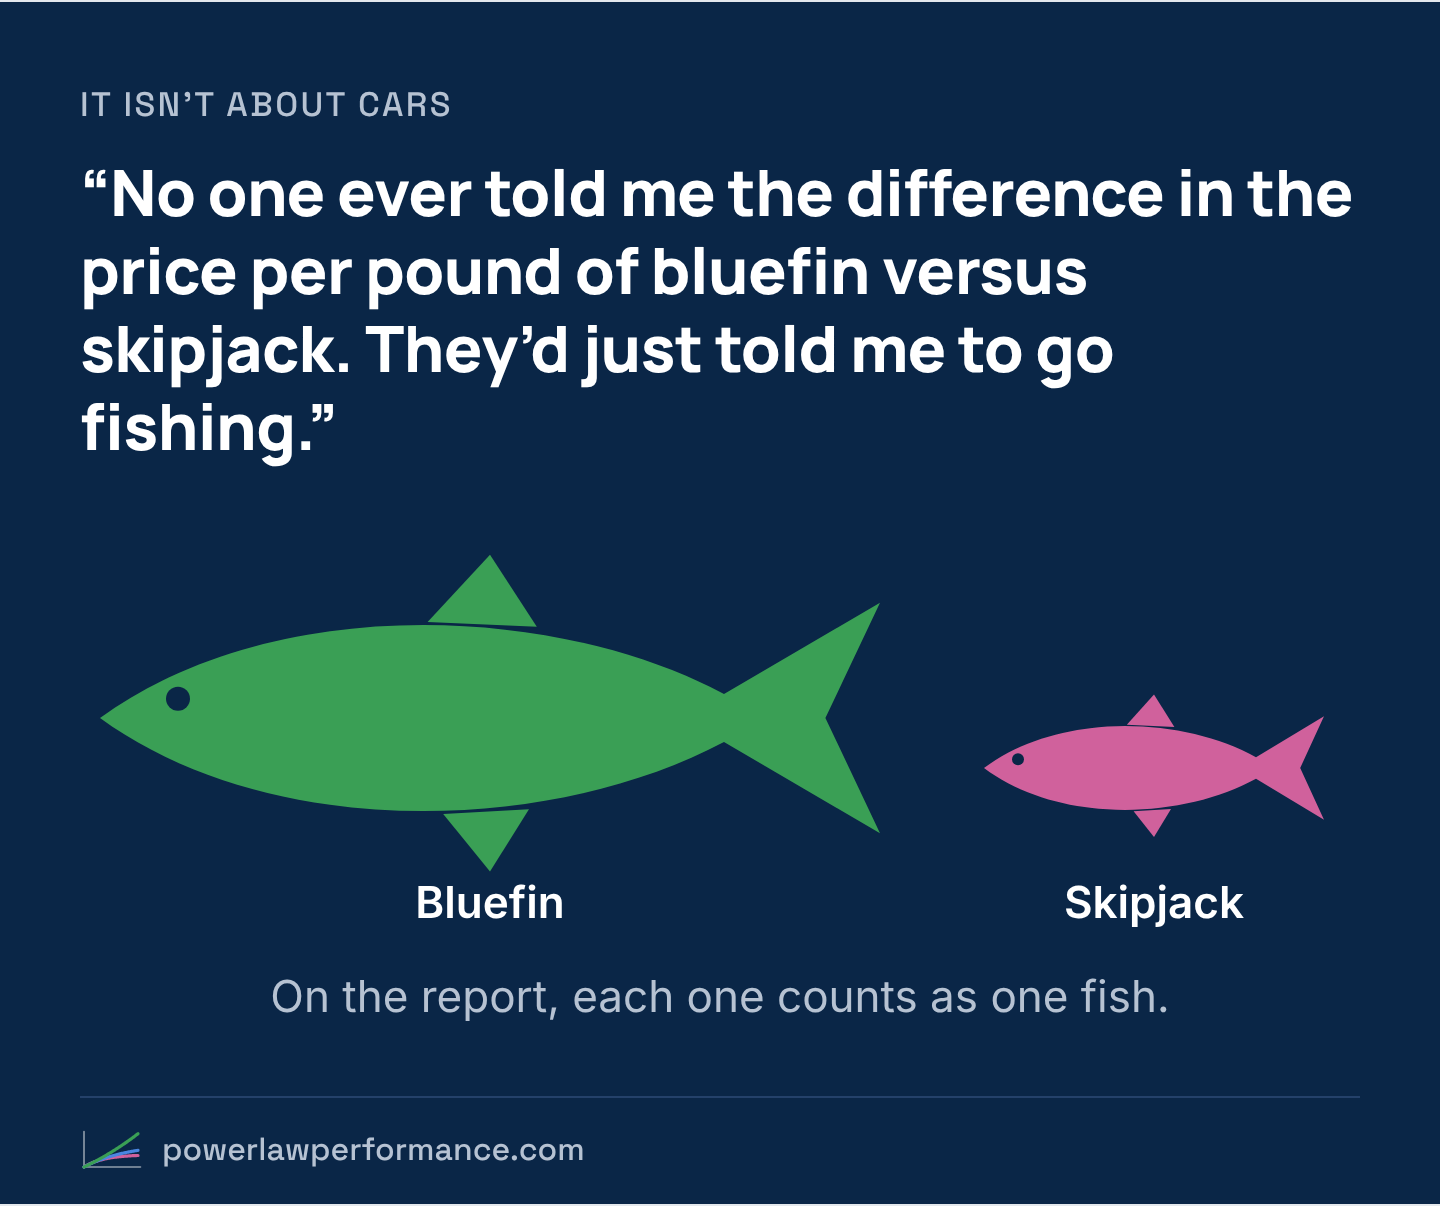
No one ever told me the difference in the price per pound of bluefin versus skipjack. They’d just told me to go fishing.
Scale value, not volume
The answer isn’t to stop testing or to stop advertising. It’s to test against the right target. Power Law Performance is the work of doing that at scale: finding the customers who carry the business, and anchoring every KPI to the signals that predict them.
It starts with asking your data a different question. Most reporting asks how many: how many leads, how many sales, at what cost each. Power Law Performance asks which: which accounts carry the book, and what did they look like before anyone knew? That’s the lens a business looking to scale value should read its data through.
It comes down to four moves.
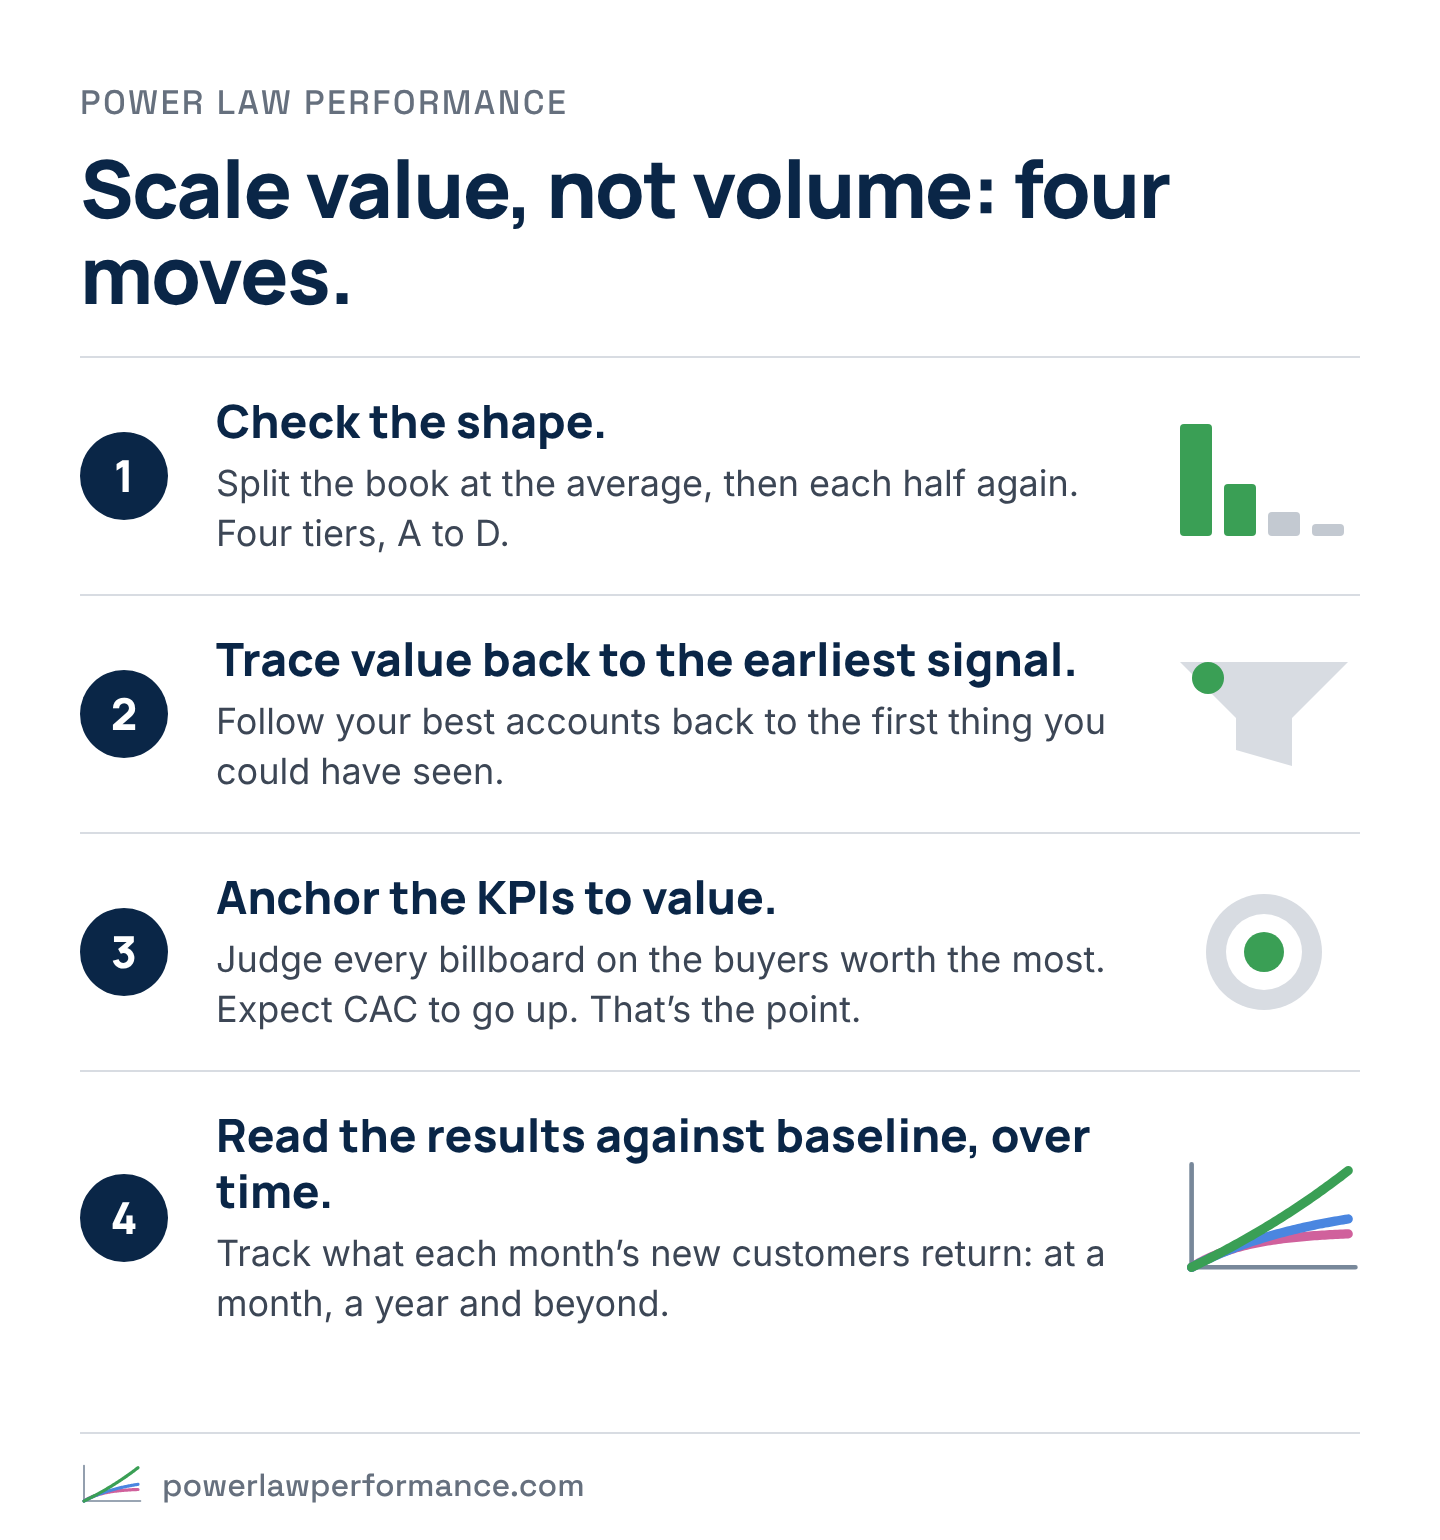
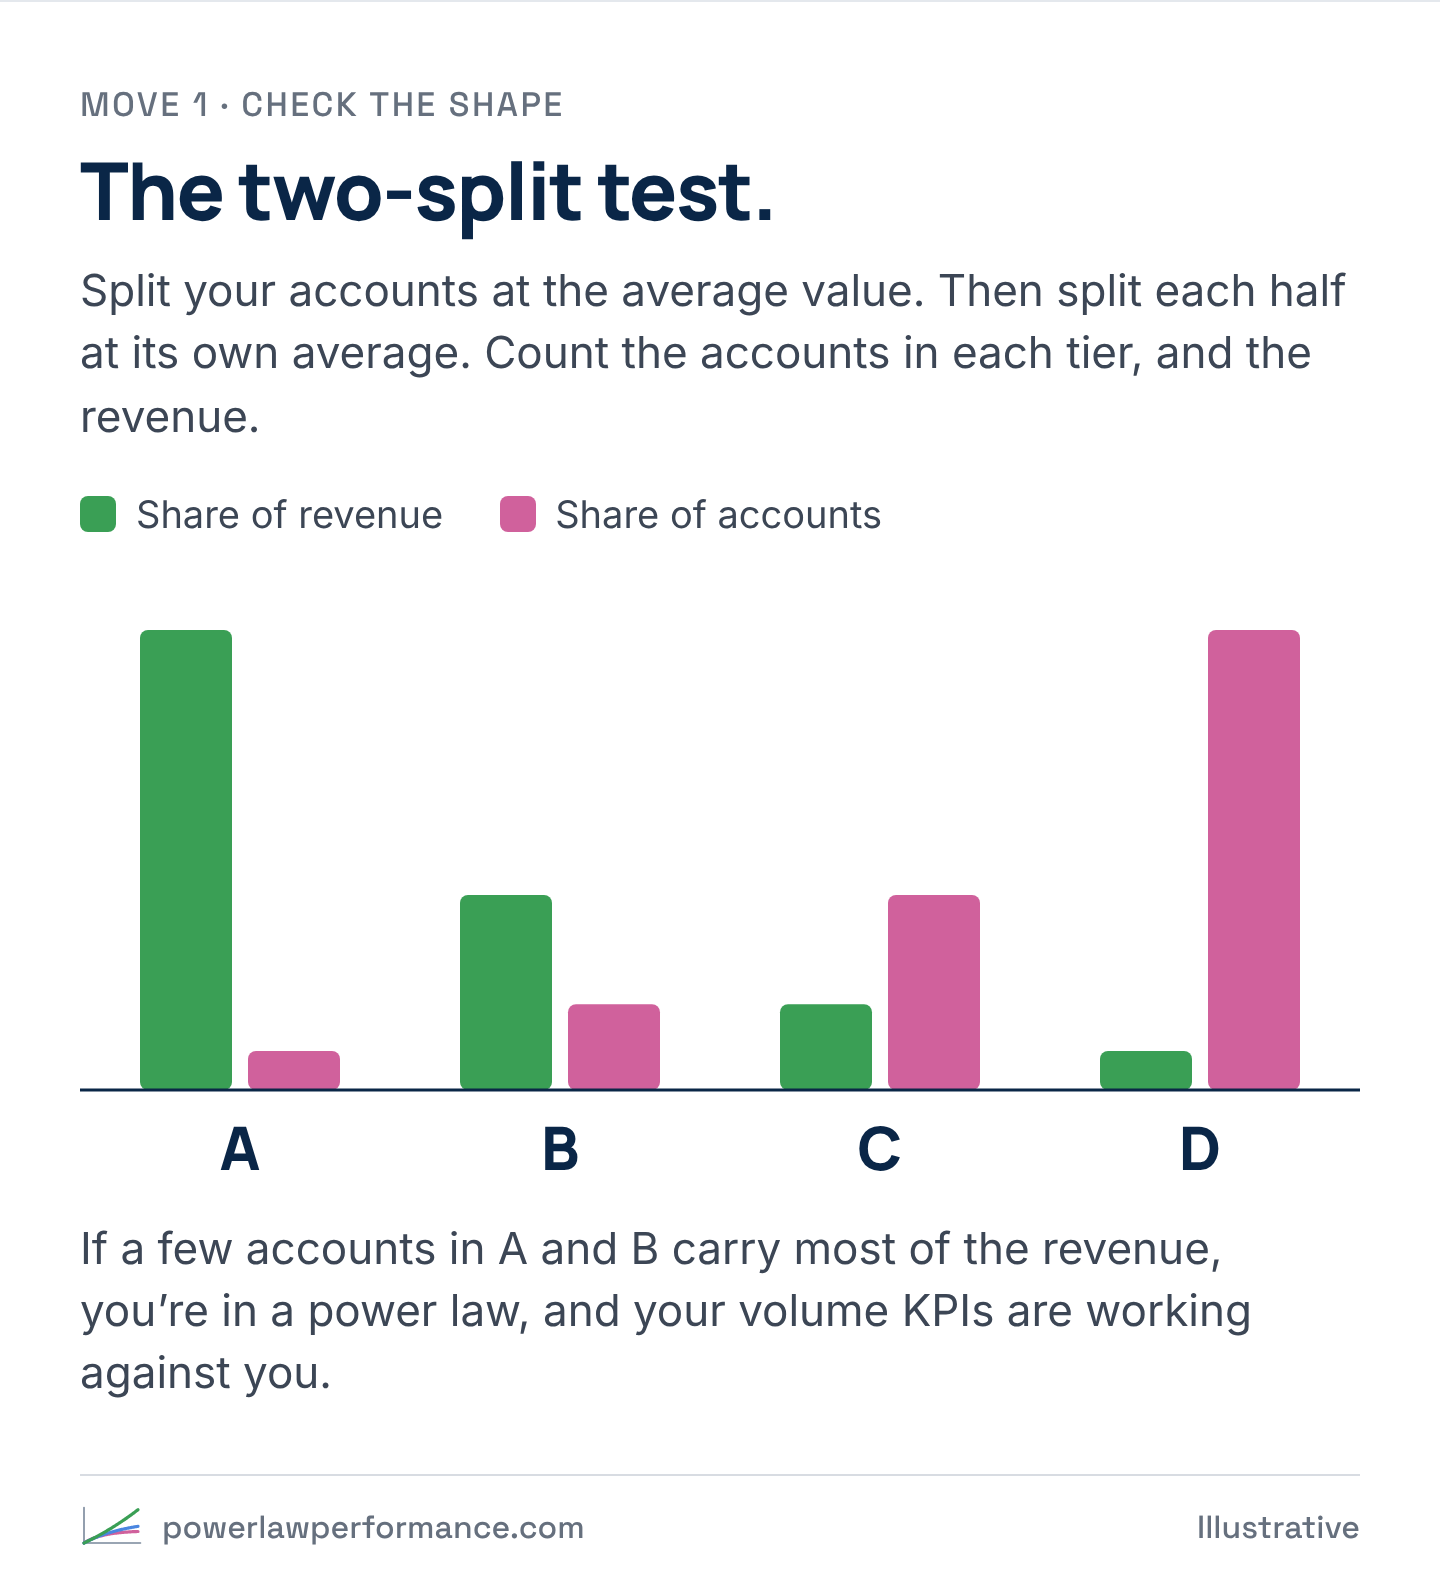
- Check the shape. Take every account and what it’s worth over time. Split the book at the average, then split each half at its own average, and you have four tiers, A through D. If a small share of accounts sits in the top tiers and carries most of the revenue, you’re in a power law, and your volume KPIs are working against you.
- Trace value back to the earliest signal. Follow the top-tier accounts back through the funnel to the first thing you could have seen. At the dealership it might be as simple as what the buyer drove in on, what they asked about first, or whether they had a trade-in.
- Anchor the KPIs to value. Judge billboards on how many above-baseline buyers they bring in, not how many cars they sell. Tell the ad platform only about the conversions that carry the signal, and starve it of the rest. Expect your CAC to go up. That’s the point.
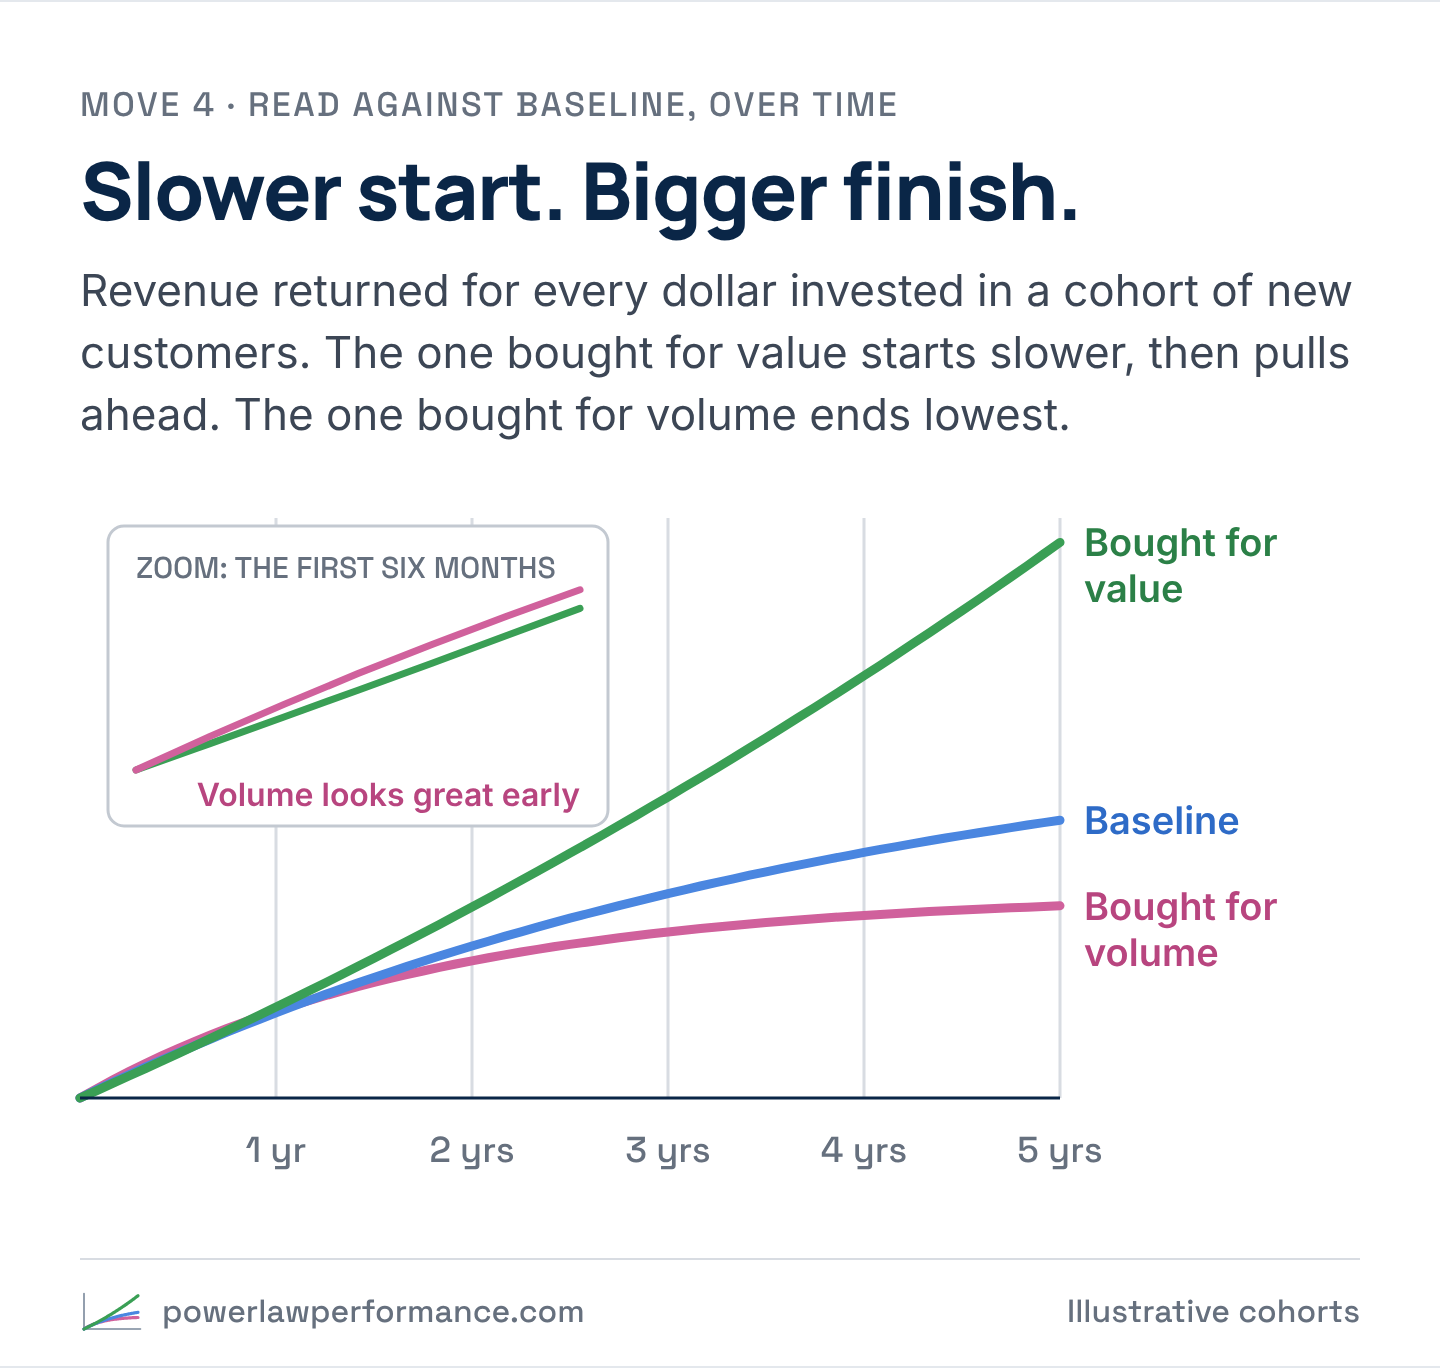
- Read the results against baseline, over time. A cohort bought for value usually starts slower, because each customer costs more to win. Then it pulls ahead, because those customers keep paying. A cohort bought for volume looks great early and ends up lowest. You only see the difference if you track what each month’s new customers return for every dollar invested, at a month, three months, a year and beyond, against what the business would have done anyway.
Signals: the data you don’t have yet
Three years after Akerlof, the economist Michael Spence asked the next question: if the buyer can’t see quality, how does the better side of the market get noticed? His answer was signaling. A signal is something that is easier for the high-value side to send than for the low-value side to fake. His example was a college degree. The degree didn’t prove someone could do the job. It sorted the people who were willing to put in the work to earn one, and that turned out to predict who would do the job well.
The same idea runs a funnel. Most businesses analyze the data they happened to collect: source, campaign, cost, close date. That’s a fine place to start, and reading it through the power-law lens will show you more than you expect. But the signals that predict value usually aren’t in that data yet. They have to be put there on purpose.
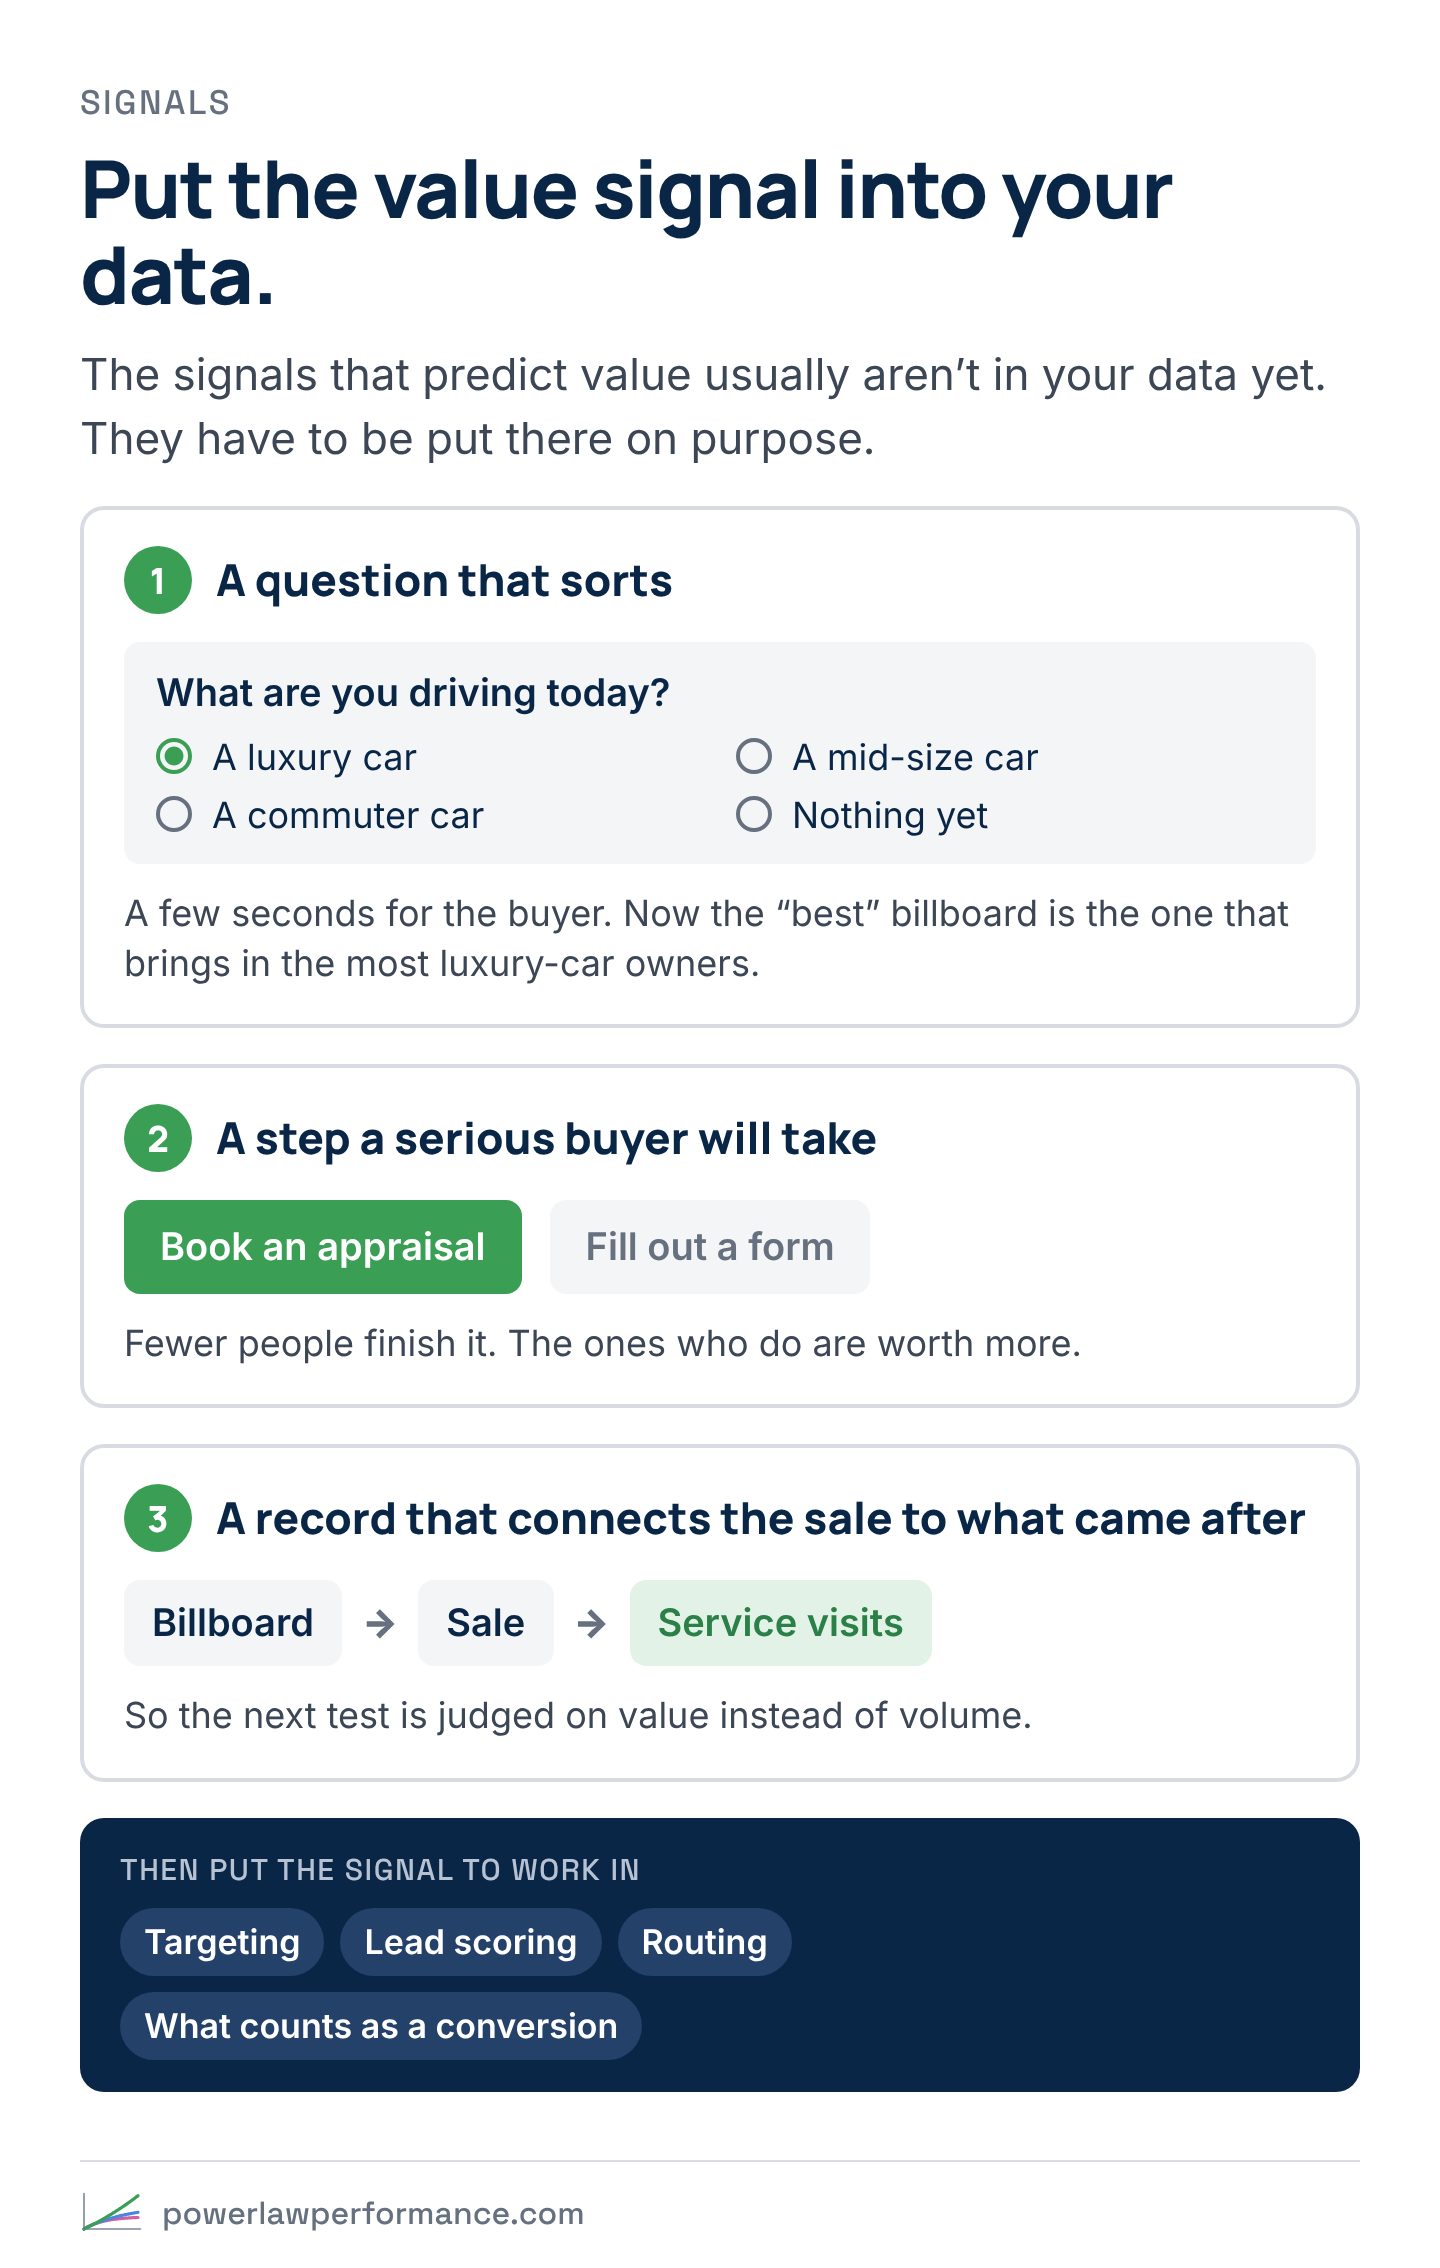
At the dealership, that could look like:
- A question that sorts. “What are you driving today?” asked on the first form or at the front desk. It costs the buyer a few seconds, and our “best” billboard is now the one that drives the highest volume of luxury car owners, regardless of whether they buy a car or even which car they buy.
- A step that’s easy for a serious buyer and a nuisance for a tire-kicker. A booked appraisal or a phone call instead of a web form. Fewer people complete it, and the ones who do are worth more.
- A record that connects the sale to what came after. Service visits tied back to the billboard that brought the buyer in, so the next test can be judged on value instead of volume.
Then the signal goes to work: in targeting, in lead scoring, in routing buyers to the right salesperson, and in what the ad platforms are told counts as a conversion. You aren’t rejecting anyone. You’re sorting them.
That’s the shift. Analyze the data you have through the power-law lens, then start implementing signals so the data you have next quarter can tell value from volume at the point of sale. It’s also where most of our work with clients starts: reviewing the signals already hiding in their data, and recommending the ones they should start collecting.
The earlier a value signal shows up in the funnel, the more it’s worth. A signal you only find after a year of service records explains the past. A signal you see on the first form or in the first conversation changes who walks onto the lot.
The billboard is still up
Out on the highway, the best-performing billboard in the dealership’s history is still the supercar with “FREE!” across it. It has the lowest CAC the dealership has ever recorded, and it fills the lot every weekend. By every number on the report, it’s the best ad you’ve ever run.
That’s what makes it so hard to take down. It works.
Value was never the sticker price, and it was never the number of cars sold. Power Law Performance is how you find the customers who carry the business and build KPIs that go get more of them. Over the coming weeks I’ll walk through where it shows up and what to do about it, one number at a time.
Sources
- George A. Akerlof, “The Market for ‘Lemons’: Quality Uncertainty and the Market Mechanism,” Quarterly Journal of Economics 84, no. 3 (1970): 488–500.
- Michael Spence, “Job Market Signaling,” Quarterly Journal of Economics 87, no. 3 (1973): 355–374.
- The Nobel Prize in Economic Sciences 2001, awarded to George A. Akerlof, A. Michael Spence and Joseph E. Stiglitz “for their analyses of markets with asymmetric information.”